
Challenges for the marine environment
In this section, we describe the range of non-fishing stressors acting on the marine environment, including climate change, land-based impacts, diseases and invasive species, plastic pollution, and their cumulative effects. We then provide an evidence synthesis on how commercial fishing challenges the marine environment, focusing on the ecosystem.
Contents
Fishing is one of many stressors on our oceans
The marine environment is under enormous stress, with environmental degradation and worldwide declines in biodiversity. Some of these impacts are also seen here in Aotearoa New Zealand.[1] We rely on healthy stocks of fish as a food source, which is dependent on the health of the marine environment and ecosystem. Fisheries management cannot focus solely on changes to fishing, but the poor integration of the Fisheries Act 1996 with conservation legislation makes this challenging.
Fishing is one of many stressors on fisheries stocks, marine ecosystems and the marine environment. All forms of fishing are, in turn, impacted by the other stressors on our marine environment. Aside from fishing, there is a growing body of evidence about the impact of other activities and issues on our marine environment and ecosystems, including climate change and land-based activities. Both are understood to have ongoing impacts on our fisheries and wider marine environment. Mitigation efforts and innovative ideas, if implemented in an appropriate and timely way, can help to curb these.

Sediment near Okura. Image credit: Geoff Reid NZ.
Other stressors include diseases and invasive species and plastics in the marine environment. None of these issues occur in isolation. Their cumulative effects compound in the environment and need to be considered together in a framework, alongside fishing, to address ongoing issues. The challenges faced by commercial fisheries therefore need to be understood and addressed in the context of other environmental stressors and their cumulative effects.
The challenges faced by commercial fisheries therefore need to be understood and addressed in the context of other environmental stressors and their cumulative effects.
Growing the knowledge base around basic ecosystem functioning is important to determine the extent of different stressors on marine environments. There is a need to understand what’s most important in an ecosystem, what causes the most damage and what the other stressors are, to inform management across an integrated system.
Before we delve into details about the impact of fishing on target species, and on non-target species, ecosystems, and the marine environment as whole, we first briefly highlight the evidence for how key stressors impact the marine environment and ecosystems, and how this creates a challenging context for commercial fisheries management. This section details the added stressors that place more pressure on our marine environment, providing context for why we must improve how and where we fish to avoid irreversible tipping points in our shared ocean.
Other stressors in the marine environment that we do not discuss here include indirect factors such as population pressure and a growing population, and other commercial marine activities such as aquaculture, mining and the energy sectors, and maritime transport.
The discussion of various stressors acting cumulatively in the marine environment underpins recommendations in Themes 1, 2, 3, 6 and 7.
Climate change is a huge threat to our oceans
Climate change threatens the stability of our oceans and fishing as we know it.[2, 3] Aotearoa New Zealand’s marine life is adapted to a relatively stable environment, so even small changes may have a significant effect. The changing climate is already impacting both the ocean and fisheries (see appendix 2).[1, 4–7] Climate-related challenges are emerging – for example, the movement or expansion of fish stocks into areas where there is no quota held, as the ocean warms. Responding and adapting to climate change must therefore underpin our approach to fisheries management.
For these reasons, climate change could be a catalyst for refining Aotearoa New Zealand’s fisheries management into a more responsive instrument, nimble in its response to expected and unexpected changes. Fisheries New Zealand has four fisheries-related projects on climate change underway to address this.
Climate change could be a catalyst for refining Aotearoa New Zealand’s fisheries management.
Monitoring, modelling and scenario analyses all help to shape a picture of what the future may look like in a changing climate, but all are riddled with gaps and uncertainty.[8] This uncertainty is due to limited data to inform models, but also because we do not understand enough about the complex and varied interactions that occur in the marine environment to know what the outcomes may be. Even with knowledge gaps, we know that:
- Changes are already happening. Fishers, fisheries managers and researchers are already seeing changes that may be attributable to climate change, but the lack of data and monitoring make it difficult to assess, plus causal mechanisms are not well understood. In Alaska, the Pacific cod[9] fishery has been closed for the 2020 season not because of overfishing but due to climate change impacts. In Aotearoa New Zealand, these changes are the subject of multiple studies.[10] For example, researchers believe that poor recruitment in the CRA2 rock lobster fishery is partly driven by climate change (see case study: Mixed messages: Are we overfishing our rock lobsters?). Links between changing weather patterns and important commercial stocks such as snapper, red cod/hoka[11] and rock lobster/crayfish/kōura[12] have been identified.[13–15] Declining green-lipped mussel/kuku[16] populations around the country may also be partly attributable to a changing marine environment due to climate change (overfishing and sedimentation have also been identified as key drivers).[17] Iwi in Horowhenua have noticed a decline in a taonga freshwater eel species with research pointing to affects from climate change.[18] In Lyttelton, a loss of bull kelp/rimurapa[19] leading to a decline of mussels and degradation of the ecosystem has been observed, both attributed to climate change.[18]

Climate change may be leading to more frequent marine heatwaves. This image shows a marine heatwave to the northwest of Aotearoa New Zealand in November 2020. Image credit: NIWA, with data from NOAA (CC BY-NC-ND 4.0). Click to enlarge.
- Further changes are imminent. Extensive climate-induced changes are expected in the marine environment over the next few decades.[20, 21] Climate change will have a significant impact on oceans but the exact ecosystem-level implications – the changes in species composition, distribution, and habitat impacts – are unknown.[22–24] These all increase the risk of unforeseen and rapid changes to species and communities, particularly in combination with other stressors such as fishing pressure, ocean acidification, temperature shifts, and habitat changes.[10, 25] The increased carbon dioxide in our atmosphere is causing ocean acidification, which is known to cause direct and indirect harm to marine ecosystems[26] – this is of particular concern (see appendix 15: Ocean acidification studies underway). The Moana Project has been set up to investigate ocean circulation, connectivity and marine heatwaves by harnessing commercial fishing vessels for data collection and providing an open-access database (see case study: The Moana Project – arming vessels with sensors to help validate ocean models). Australian researchers are undertaking research for the federal government to determine strategies for fisheries management to address climate change.[27, 28] A similar exercise may be beneficial here.
- Mitigation and adaptation are both needed. Climate change is a global issue. Even if we do everything we can to mitigate climate change impacts locally, actions and responses from other countries will affect the changing climate here in Aotearoa New Zealand. It is certain that our fisheries industry will need to adapt. A key point highlighted by the Aotearoa Circle’s scenario planning efforts is that, whether significant warming occurs or abrupt decarbonisation takes place to dampen global heating, the fisheries industry is going to face significant changes in how and where they can operate. The ability to rely on fisheries resources as we do today is not a given, and evidence-based management will play a crucial role in future-proofing our fisheries to withstand climate change impacts.
- Aotearoa New Zealand will not be the worst affected. Predictions of climate change impacts on the marine environment suggest that the relative impact on our EEZ may be less than other countries, which may provide a competitive advantage – a small silver lining in a gloomy global outlook.
The ability to rely on fisheries resources as we do today is not a given, and evidence-based management will play a crucial role in future-proofing our fisheries to withstand climate change impacts.
An increasing proportion of fisheries stakeholders acknowledge that the issue of climate change should be high priority for fisheries management, especially as anecdotal evidence increasingly points to its immediate impact on our marine environment. Rather than summarise the wealth of literature relating to climate change, the marine environment and fisheries (as has been done elsewhere – see [5, 6, 10, 29–32]), here we highlight what climate change means for how we manage our fisheries and the resulting guiding principles to underpin fisheries management approaches.
Staying at the leading edge of fisheries management in a changing climate will require:
- Being responsive, adaptable and flexible. The inherent uncertainty in the timing and extent of climate-related impacts makes it difficult to plan for, but itself dictates the need for a regulatory and management framework that allows for nimble responses to changing circumstances, recognising regional variation. This may demand a shift in thinking away from the spatial and single-species approaches because, for example, the species mix in an area may change significantly from year-to-year in response to water temperature.
- Ongoing monitoring to inform actions. This will require long-term data gathering to inform decisions on faster timelines (see section: Changing fisheries demand nimble and responsive decision making).
- Taking a holistic approach. Acknowledging that the stressors from climate change will be acting in concert with stressors from other activities, such as land-based impacts and fishing practices, and applying buffers to allowances to support system resilience (see section: Cumulative effects mean these stresses compound).
- Mitigation efforts. Cutting emissions in fleets, supply chains and wider organisations will be necessary and will require innovative ideas to transition to a zero-carbon way of fishing.
A number of the innovative ideas outlined later in the report can help achieve these goals (see section on innovation and tech).
These principles are driving factors for recommendations in Themes 1, 2, 3, 5 and 7.
Land-based activities impact coastal fisheries
The degradative impacts of land-based activities on the marine environment are well described. Linkages between the land and sea are of critical importance for our fisheries. Shallow coastal waters, harbours, intertidal areas and mangroves are key breeding and nursery areas for many coastal fisheries, including some important commercial fisheries, and are important for primary productivity. These areas are known to be under increasing pressure from land-based activities (see case study: How a chemical fingerprint identified Aotearoa’s most significant snapper nursery).[33] Although not discussed in this report, land-based impacts can be significant for freshwater fisheries, particularly through barriers such as dams, culverts and sea openings, which can be a driver for migratory species habitat loss and affects species such as freshwater eels, whitebait, and flounder.[34]
Sedimentation is an accumulating problem in the marine environment
An important land-derived issue facing our coastal waters is the run-off of sediment and nutrients. In terms of the threat to marine habitats, in one study researchers identified land-derived sedimentation as equally threatening as bottom trawling, with only ocean acidification and rising sea temperatures ranking higher[35] – although relative impacts are obviously context-specific and particular to the impacted habitat.
Aotearoa New Zealand has some of the highest sediment run-off of any country in the world, contributing an estimated 1% of worldwide sediment input into the marine environment from our coastlines. In total, Aotearoa New Zealand loses around 35 million truckloads of soil from the land into the sea each year. Once in the sea, it permanently alters the marine environment. Accelerated sedimentation affects coastal environments around the country and ongoing run-off compounds the effects of erosion that has been occurring for many years.
Aotearoa New Zealand has some of the highest sediment run-off of any country in the world, contributing an estimated 1% of worldwide sediment input into the marine environment from our coastlines.

Aotearoa New Zealand has some of the highest sediment run-off in the world. Image credit: Geoff Reid NZ.
Vegetation slows rain from hitting the ground and stabilises the soil structure with roots. Therefore, when vegetation is removed, more rain hits the land and more soil erodes into the sea. Aotearoa New Zealand has a naturally high rate of soil loss in some regions due to a combination of soil types, hilly geography, and high and intermittent rainfall, but land uses that remove established vegetation – such as agriculture, forestry and coastal land development – have accelerated this.[36–38] Wetland loss is another contributor to marine water quality: wetlands trap sediment and can remove nitrates from run-off, but around 90% of Aotearoa New Zealand’s pre-European wetlands have been drained. There is a lack of long-term data tracking sediment accumulation but scientists have found evidence of our land-based activities changing sediment in Aotearoa New Zealand’s marine environment following humans’ first arrival in 1500 AD.[17]
When soil and sediment run-off enter the marine environment, it has an adverse effect on marine ecosystems through a number of changes that cascade and interact,[39] including:
- Smothering bottom-living organisms. There is evidence that areas that used to be habitats for cockles[40] and pipis[41] decades ago are now below mud.[42]
- Changing habitats on the seafloor. Sediment can settle on marine plants and seaweeds, smother them, and stop the population replenishing.[43] This includes kelp forests.[44] Because plants provide habitats for other living organisms and fuel the food chain, this decreased productivity negatively affects the ecosystem. Some commercial fisheries have nursery grounds or habitats in areas that are highly susceptible to accelerated sedimentation, such as blue cod/rāwaru[45], which are bottom-dwelling fish predominantly found coastally near rocky reefs.[22]
- Reducing water clarity in coastal areas. Sediment can block light shining through to plants, limiting their energy intake and growth, and plants can’t grow as deeply because of the opacity of the water.[42] Subtidal seagrass meadows, which are important nursery grounds for juveniles of some species, are now mostly restricted to offshore islands around Aotearoa New Zealand.[46]
- Clogging the gills of filter feeders. Sediment will stress filter feeders, such as bivalve shellfish like pipi and tuatua[47], by making them slower or requiring them to use more energy. If this leads to the loss of filter feeders in an area, it would have cascading effects on that ecosystem.
- Changing fish gill structure. There is evidence that turbidity causes changes in the gill structures of some species, such as snapper. In one experiment, juvenile snapper exposed to more turbid conditions lost weight, but their oxygen uptake was not affected.[48]
- Loss of amenity value. Increased sedimentation in harbours has led to the loss of sandy beaches, expanding mangrove forest filling in harbours, and requirement for dredging to maintain navigable waterways.
- Poisoning marine life where sediments carry toxins. See section on contaminants below.
More sediment is discharged into the marine environment in heavy rain and extreme weather conditions, so climate change is likely to exacerbate these issues. Storms can also cause settled sediment to re-suspend in shallow marine waters which can aggravate the conditions.
Addressing sedimentation is difficult due to the large number of different sources that contribute, including conservation land, forestry, agriculture, earthworks and stream bank erosion.[49] It will require removing pressures on the environment (e.g. replanting trees and changing land management practices) and active efforts to restore environments (e.g. replanting seagrass or transplanting bivalves). Alone, neither is sufficient because even if no further sediment affects an area, it still has the lasting damage from sediment to date. Restoring a habitat will have limited benefits if further sedimentation will occur in that area.
Knowledge of how to restore environments is growing, but restoration trials are generally required for the specific location. For example, some studies have determined that mussels play a critical role in filtering out sedimentation and nitrogen cycling (denitrification). Efforts to restore mussels in areas where they have declined or been lost could help to remediate the negative impacts from land activities. Community groups and researchers are working together to determine how to best restore shellfish and seagrass in a number of places around the country, including Tīkapa Moana the Hauraki Gulf, Te Tauihu-o-te-waka Marlborough Sounds and Te Tai Tokerau Northland.[50]
Addressing sedimentation will require removing pressures and active
efforts to restore environments.
The Tai Timu Tai Pari Hauraki Gulf Marine Spatial Plan has recommended a series of active restoration efforts in the Hauraki Gulf Marine Park (see case study). A review of habitat restoration methods commissioned by the Ministry for Primary Industries is underway to inform these efforts. Sedimentation is a significant focus for councils and a major component of the National Policy Statement for Freshwater Management 2020, which provides local councils with direction on how they should manage freshwater under the Resource Management Act 1991. This is an issue that will take time and national emphasis to address.
Contaminant issues tend to be more localised
Land-based activities can lead to the introduction of contaminants into the marine environment, either via sediment loss (i.e. fertilisers within the sediment) or through other discharges in the environment. These issues tend to be more localised and less likely to impact the whole ecosystem, but are still important and may require localised approaches to mitigate harms. Examples of contaminants that can affect the marine environment include:
- Pollution from vehicles. Heavy metal contaminants, oil and microplastic pollution are deposited on roads and then wash into waterways. Heavier road traffic near the coast is the biggest cause, as seen in Tāmaki Makaurau Auckland where marine sediments in the upper Waitematā Harbour have high levels of lead, zinc, copper and polycyclic aromatic hydrocarbons resulting from the discharge of stormwater from roading.[51, 52]

Heavy metal contaminants and other pollutants can enter the marine environment after being washed from roads.
- Discharge of waste products. Sewage and other pollutants in urban stormwater can make their way into the marine environment, typically during heavy rain or flooding. This can upset the balance of nutrients in the marine environment, create public health risks and result in the loss of amenity values, particularly when the sewage has not had adequate treatment.[1] Increases in storm frequency, which may result from climate change, will increase the number of these discharge events.
- Use of fertilisers. When fertiliser is used, particularly for intensive farming, it frequently leads to nutrients washing into the marine environment, which can upset the nutrient balance and lead to excess growth of some organisms, including triggering algal blooms, deoxygenation and dead zones.[53]
- Materials and paints. Pollutants and toxic substances can enter the environment after being released from materials such as unpainted galvanised iron roofs or antifouling paints used on boats.
All of these stressors provide challenges for commercial fisheries, who may need to harvest sustainably in a contaminated (and stressed) environment.
Fisheries management and land-based regulations are not integrated
Despite a strong evidence base showing that land-based activities affect our marine environment and fisheries, there has been limited work to incorporate this knowledge into management decisions or to manage land-based activities. There are increasing localised efforts to do so, but progress is slow given the challenges of balancing impacts of the sectors using the land. This does not necessarily indicate a legislative gap, but may represent a failure in implementation.
Land-based activities affect our marine environment and fisheries, but there has been limited work to incorporate this knowledge into management decisions.
The New Zealand Coastal Policy Statement 2010 does provide guidance to local authorities in their day-to-day management of the coastal environment, including guidance on waters managed or held under other Acts (see Policy 5).
Some research, monitoring and restoration efforts are underway in Aotearoa New Zealand relating to land-based impacts on the marine environment, such as the Whaingaroa Harbour Caregroup in Raglan whose members plant trees to improve the coastal environment. The Integrated Kaipara Harbour Group is looking at some approaches to prevent and mitigate land-based impacts, including retiring steep slopes from productive use. Other multi-stakeholder groups are taking an integrated approach for land, water and infrastructure management to protect the marine environment including the Fiordland Marine Guardians (see case study) and Te Korowai o te tai ō Marokura in Kaikōura (see case study).
Improving the sustainability of our fisheries requires better management of land-based activities. This currently falls outside the realm of fisheries management but highlights the need for an integrated approach to both monitoring and management. A national view of the impacts of land‐based influences upon seafood production does not exist; this could be facilitated by better coordination and planning of the many disparate marine monitoring programmes operating around the country. Estuary management would also need to be incorporated into an integrated approach. This would align with the Parliamentary Commissioner for the Environment’s call for an approach to managing estuaries that treats estuaries and the waterways that feed into them as a single entity from the mountains to the sea, ki uta ki tai.
This discussion underpins recommendations in Themes 1-3.
Diseases and invasive species threaten the marine environment
Invasive species are widely recognised as one of the greatest threats to marine biodiversity, having already transformed many marine habitats around the world.[54] The most harmful of these displace native species, change ecosystem structure and food webs, and alter fundamental processes, such as nutrient cycling and sedimentation, all of which can trigger a loss of ecosystem services.[54, 55] Most invasive species do not permanently establish in a new environment, but when this does happen, the consequences can be significant.
Invasive species are widely recognised as one of the greatest threats to marine biodiversity, having already transformed many marine habitats around the world.

A biosecurity diver checks pontoons in the Viaduct Harbour for invasive species. Image credit: Crispin Middleton/NIWA.
Pathogens and invasive species can enter and spread through the marine environment via vessels, human-mediated transfer, aquaculture, plastic pollution and other mechanisms.[56] Global trade and transport are the leading way that bioinvasion occurs[57] and the risk of new species being introduced into ecosystems and disrupting biodiversity is growing because of increased marine traffic.[1] Some border regulations and international policies already exist to reduce the risk of introduction of non-Indigenous species from the most common entry points, including requirements to demonstrate biofouling and ballast water management.[58] Efforts to actively prevent invasive species from entering regions throughout Aotearoa New Zealand help maintain biodiversity.
Other stressors on the marine environment increase the threat of invasive species displacing native species. Floating plastic can carry invasive species across our oceans.[59] Organisms can ‘hitch a ride’ on plastic and move into otherwise inaccessible territories.[60] The accumulation of plastic pollution in the ocean means this risk continues to increase (see section on plastic).
Climate change is another stressor that will amplify the impacts of invasive species by making their spread, survival and establishment easier.[21] Diseases and invasive species can enter from outside our waters but can also be spread domestically around Aotearoa New Zealand.
One example is toxoplasmosis, a disease caused by a parasite[61] which can infect Hector’s dolphin/tūpoupou and Māui dolphin/popoto[62] populations. The parasite is spread into the marine environment through rainwater and run-off. There is a current action plan to mitigate the population decline caused by this disease.[63] This is an issue where many of the management strategies needed to reduce transmission are far-removed from the marine environment (e.g. reducing feral and stray cat populations). Another example of a harmful parasite is Bonamia ostreae, which can kill Bluff or dredge oysters/tio.[64–66] Overseas oyster fisheries have been severely damaged by the parasite and similar impacts are possible here – the parasite was first detected in Te Tauihu-o-te-Waka the Marlborough Sounds in 2015. The Ministry of Primary Industries-led long-term management response includes a governance group comprising of many different players (Biosecurity New Zealand, Aquaculture New Zealand, Fisheries New Zealand, Environment Southland, Awarua Runaka, Southland District Council, and the Bluff wild oyster fishery).
Recognising the growing threat of diseases and invasive species to the marine environment, some regional approaches to marine management are prioritising biosecurity. For example, Te Korowai o te tai ō Marokura in Kaikōura (outlined in case study here) are looking to the approaches used by the Northland and Southland regional councils for inspiration. The Fiordland Marine Guardians (outlined in case study here) have taken it further by being the first area to implement a domestic pathway management plan, which sets out rules and standards that must be met by all vessels entering the region for biosecurity.[58]
Increasing pathogens and invasive species will make marine ecosystems less resilient to other stressors and the establishment of invasive species and introduction of disease could have major consequences for the commercial fishing industry. Actions to reduce the risk from invasive species and diseases will be important to maintain a sustainable commercial catch.
Plastic pollution is building in the ocean
Most plastic that enters the environment ultimately ends up in the ocean. Local charity Sea Cleaners remove approximately 160,000 litres of rubbish from Aotearoa New Zealand’s marine environment every month.
Of the 86 million tonnes of plastic thought to be in oceans worldwide, it is estimated that 80% came from land and the remaining 20% from activities at sea – with commercial fisheries being a large contributor.[67] Estimates indicate that around 99.5% of the plastic in the ocean is below the surface where it damages habitats or is mistaken for food, contributing to declines in marine biodiversity.[68–70]
Plastic is known to impact commercial fisheries stocks or the ecosystems that they rely on through physical harm (e.g. entanglement) or through other physiological impacts that occur after ingestion and Fisheries New Zealand collects some data from observers on these impacts. Species at all trophic levels can be affected, with plastic particles and the associated chemicals accumulating up the food chain. Plastic has been identified in the guts of finfish in Aotearoa New Zealand, including commercial species.[71] For fish sampled in Auckland there was a 16.3% overall ingestion rate which was comparable to global ingestion rates.[71] Plastics have also been identified in green-lipped mussels around Aotearoa New Zealand.[72]

Ghost gear and other waste made of plastic and other materials washed ashore on Te Hauturu-o-Toi Little Barrier Island. Image credit: Simon Thrush.
The physiological impacts of ingesting plastic are not clear-cut and further research is needed, but emerging evidence on a range of species at different trophic levels suggests it can cause physiological changes in health and reproduction. The impacts differ depending on whether macro-, micro- or nano-plastics are ingested, the plastic’s associated chemicals, and the concentration at which these chemicals accumulate up the food chain.
Plastic in the marine environment may also help spread pathogens and invasive species, contributing to the issues discussed in the ‘Diseases and invasive species’ section. A local study looking at plastic debris on 27 beaches along Te Tara-o-te-Ika a Māui the Coromandel Peninsula found that plastic poses a high biosecurity risk, with both native species and non‐Indigenous marine species being brought into the environment on plastic. Rope debris from fisheries and aquaculture operations was the leading way that biosecurity pests were carried in.[73]
The plastic pollution crisis has a significant negative impact on the marine environment and the organisms within it, so poses a direct risk to the sustainability of our fisheries.
The plastic pollution crisis has a significant negative impact on the marine environment and the organisms within it, so poses a direct risk to the sustainability of our fisheries. The cumulative effects of plastic causing physical or physiological harm to species, disruptions to ecosystems and habitats, and introducing invasive species to new environments, will have negative impacts on our commercial fish species and the ecosystems that they rely on.
Plastic breaks down over time into smaller pieces. The amount of plastic that can enter the food chain will therefore continue to increase as the available particles get smaller and can be ingested at lower trophic levels. The impacts of plastic pollution on fisheries is likely to get worse over time.
Currently the data we collect on plastic in the marine environment, the impacts on species and ecosystems, and the presence of plastic in marine organisms is limited and fragmented. The issue of plastics in seafood is likely to gain considerable traction in the coming years. A coordinated effort to research and monitor plastic ingestion and physiological outcomes, particularly on our commercial fisheries, is necessary.
Fisheries exports may be hindered by the contamination of seafood in the future. Microplastics are considered an emerging threat to food security.[74] Depending on what comes to light as more research is undertaken to assess the human health impacts of ingesting plastic-contaminated seafood, there is a chance that regulatory restrictions relating to food contamination could include microplastics and nanoplastics.
Microplastics are considered an emerging threat to food security.
Importantly, even without evidence of harm or regulatory action, public perception of plastics in seafood could have a seriously negative impact on the industry. If seafood is seen as a route for microplastics and associated chemical pollutants to enter the human diet, it may deter people from eating it. Aotearoa New Zealand’s commercial fisheries sector is particularly vulnerable to the economic implications associated with plastic in the marine environment because we market our seafood as pure and grown in pristine conditions.
While most of the plastic in the marine environment is outside the control of the commercial fisheries sector, a significant proportion is thought to come from commercial fishing activities. The UNEP estimates at least 640,000 tonnes of fishing gear are lost every year.[75] Ghost gear (abandoned, lost or discarded fishing gear) is a significant issue in the marine environment, some of which is plastic. The scale of ghost gear is considerable and as a result, it is recognised as a growing threat to marine life that urgently needs to be addressed. The industry can therefore make a significant difference to reduce the negative impacts of plastics on fisheries by taking action to reduce plastic use and loss through fishing activities, building on the initial steps made such as not using fish aggregating devices (FADs) in Aotearoa New Zealand waters (with some high sea exceptions) and supporting the draft FAO’s Voluntary Guidelines on Marking Fishing Gear in 2018.
The UNEP estimates at least 640,000 tonnes of fishing gear are lost every year.
These issues relating to plastic in the marine environment and possible actions for the fisheries industry to take are discussed in more detail in the Rethinking Plastics in Aotearoa New Zealand report released by our Office in December 2019. The report highlights the need for the fisheries sector to take action on plastics. It includes recommendations to Government to:
- undertake analyses to model the economic, socioeconomic and environmental benefits of changing to more sustainable plastic use on the fisheries sector, and
- to facilitate an active dialogue around rethinking plastics, by setting targets and identifying opportunities to keep plastics in circulation or shift to more sustainable alternatives.
Some work is already underway by the Ministry for Primary Industries which may help to address the issues outlined above, starting by quantifying the issues of plastics in the marine environment via fish catches, microplastics from plankton recorder transects, and the frequency and density of marine litter on the seabed.
Cumulative effects mean these stresses compound
Our marine environment and the ecosystems within it are in their current state because of many different stressors, including those already outlined, as well as fishing, as detailed below. Looking at issues in isolation fails to appreciate that these stressors can overlap in space and time and that a single activity can generate multiple pressures.
Species’ responses to different stressors can be non-linear and can cause cascading effects within an ecosystem.[76] Understanding cumulative impacts is key to predicting and preventing irreversible tipping points.[77]
Fisheries collapse is one type of tipping point driven by a range of direct and indirect factors. Perhaps the most famous example is the collapse of the northwest Atlantic cod[78] fishery in the early 1990s, which led to a moratorium on fishing.[79] Coral transitions are another well-known tipping point, where reefs shift from hard coral cover to macroalgal cover.[80] These shifts can be driven by a complex array of phenomena, including climate change, sedimentation, pollution, and overfishing. An example in Aotearoa New Zealand is the collapse of the Tasman and Golden Bay scallop/tupa[81] fishery.[22]
 - Credit Matthieu Godbout Wikimedia CC By-SA 3.0")
In the early 1990s, the northwest Atlantic cod (Gadus morhua) fishery collapsed after reaching a tipping point. Image credit: Matthieu Godbout/Wikimedia (CC BY-SA 3.0).
Aotearoa New Zealand’s coastal and marine systems are vulnerable to rapid changes or tipping points because our disconnected frameworks currently do not take an approach focused on cumulative effects.
Aotearoa New Zealand’s coastal and marine systems are vulnerable to rapid changes or tipping points because our disconnected frameworks currently do not take an approach focused on cumulative effects.[6]
Understanding the consequences of multiple stressors and accounting for these in fisheries management decisions is crucial to preserve our marine ecosystems for years to come. Recent case law has shown that decisions under the Resource Management Act (RMA) 1991 may impact on commercial fishing (see case study: The establishment of the Motiti protection areas sets a new precedent for local coastal management). Cumulative effects must be considered under both the Resource Management Act 1991 and the Fisheries Act 1996 but there is significant room for improvement in how cumulative effects are assessed and accounted for in practice under both statutes. Taking a cumulative impacts approach acknowledges that commercial fishing is not the only stressor on an ecosystem, while also recognising that a more precautionary take may be necessary because of reduced resilience in that system caused by multiple stressors.
Applying cumulative effects assessments in decision making is challenging
The activities that affect the marine environment are multifaceted and varied. Their consequences are too. This makes it complex to study and model the outcomes. Multiple methods to assess cumulative pressures and impacts exist, but each are limited in some way. Mapping methods can reveal what species overlap with stressors, but this relies on assumptions about impacts being direct and additive.[76] Experimental methods can delve into how different stressors interact – whether additive, indirect or cascading – but applying this to a large number at once is not feasible.
Advances in systems thinking, methodological improvements, increasing access to big data, and integration of assessments into legislation and regulations are making the study and application of cumulative effects modelling more feasible.[76] These assessments can be used in EAFM (see ‘Ecosystem thinking’ section), marine spatial planning (see case study: Managing land-based impacts through a multi-sector marine spatial plan) and conservation planning. Guidance on systems thinking and place-based understanding of environmental changes could be drawn from mātauranga Māori (see ‘Te ao Māori’ section).[6] Mātauranga can guide more holistic and integrated approaches for environmental decision making.[82] Concepts such as ki uta ki tai (from the mountains to the sea) reflect this holistic understanding of the environment and resource management.
Concepts such as ki uta ki tai (from the mountains to the sea) reflect this holistic understanding of the environment and resource management.

Effective management of fisheries and the ocean requires consideration of cumulative impacts: from the land to the sea, ki uta ki tai. Image credit: Hamish McCormick/NIWA (CC BY-NC-ND 4.0).
We first need to overcome some practical obstacles in order to implement cumulative effects assessments more widely.[83] Gaps in ecosystems and species data, or inaccessibility of data (as discussed in the section ‘Commercial fishing has impacts on target species sustainability’ and the section below, ‘Fishing effort has wider ecosystem impacts’), will hinder applications. We will never gather all the data needed to fully understand the cumulative impacts of stressors. A more realistic objective is to have sufficient information to allow more balanced decisions under unavoidable uncertainty.[76] Use of more consistent definitions and methods will also help to standardise processes and facilitate comparisons across systems and studies. Moving away from siloed approaches to more collaborative and connected structures that take a holistic approach to management will further facilitate these efforts.
We will never gather all the data needed to fully understand the cumulative impacts of stressors. A more realistic objective is to have sufficient information to allow more balanced decisions under unavoidable uncertainty.
This underpins recommendations in Themes 2 and 3.
As a starting point, the Sustainable Seas National Science Challenge (see case study) developed the Aotearoa Cumulative Effects framework, a decision-making tool which guides collaborative cumulative effects management through a series of questions.[84]
Davies[84] also identified gaps and where future efforts should be focused:
- Analysis of existing methods, tools and data to identify and assess cumulative effects,
- Developing guidelines/guidance for assessing cumulative effects in Aotearoa New Zealand,
- Conceptual models, risk assessments, and gap analyses to help identify sources of uncertainty and their importance, and
- Further testing and trialling of these principles and the Aotearoa Cumulative Effects framework in real-world case studies to adapt these tools for use across spatial and temporal scales.
Whether a particular fishery can cope with losing a proportion of its population each year depends on more than the amount taken. The fishery may be under stress from sedimentation occurring in the nursery ground and destroying the juvenile habitat, or may have to adapt to changing environmental conditions that reduce food availability. Neglecting to consider the wider pressure on the ecosystem may increase the risk of collapse because the population may be less resilient.[2, 85] Ultimately, even though it is complex and difficult to implement cumulative impacts assessment, fisheries management cannot afford not to do this.
Whether a particular fishery can cope with losing a proportion of its population each year depends on more than the amount taken.
Commercial fishing has impacts on target species
By definition, commercial fishing has a direct impact on the species that are harvested. Since harvesting of target species is discussed in depth in the section ‘Commercial fisheries in 2020’, this obvious impact is not discussed further in this section.
Fishing effort has wider ecosystem impacts
Fishing is one of the stressors on the marine environment. The stress imposed by fishing is not uniform – the relative importance of fishing as a detrimental impact on the ecosystem depends on location, target species, size of catch and the methods used (illustrated here). This section of the report explores what we know about the impacts of fishing on marine ecosystems, current data and reporting of this information and related measurements of performance, and opportunities for improvement in the future.
Data that helps us understand ecosystem health and the role that fishing and other impacts can cumulatively play in driving ecological change is important to manage a fishery, in addition to data on single-species and fish stocks covered in ‘Commercial fisheries in 2020’. Knowledge about species and habitats is a key component of understanding these impacts, but exploration of Aotearoa New Zealand’s marine environment is still at an early stage.[23] This section is separated into the following areas:


Much of our monitoring and data collection is focused on commercial species, which are not necessarily good proxies for ecosystem health. There are many clear and well-studied environmental impacts of fishing activities but there are also significant data and knowledge gaps. The Ministry for the Environment states that there is insufficient information about tipping points in our marine ecosystems, as well as the environmental limits around the sustainable use of marine resources.[24] This is partly due to a strong focus on managing stocks and some direct environmental impacts rather than considering the broader ecosystem effects (which require more information and are harder to predict).[86]
There are many clear and well-studied environmental impacts of fishing activities but there are also significant data and knowledge gaps.
The Ministry for the Environment reports on environmental performance, including pressures and changes. The most recent environmental reporting on the marine environment (including oceans, seas, coastlines and estuaries) was delivered in 2019 and occurs every three years.[1, 87]
Fisheries New Zealand also reports on environmental and ecosystem factors in their Aquatic Environment and Biodiversity Annual Review (AEBAR). The AEBAR is published every year although not all sections are updated annually (they are updated as new information becomes available and are substantially overhauled when large pieces of research are completed). Research is also undertaken by the Department of Conservation, particularly through their Conservation Services Programme.
Most common commercial fishing methods
This schematic gives a high-level overview of fishing methods used commercially, with some pros and cons of each method, to guide the non-expert reader.

Click to enlarge.

Click to enlarge.

Click to enlarge.
Download the fishing methods schematic (PDF, 2MB)
Icons adapted from Zlatko Najdenovski, Freepik, monkik, iconixar, mavadee and eucalypt via Flaticon.
Bycatch of non-target and protected species
Non-target species or bycatch are those taken as catch during fishing operations where they are not the intended target of fishers. While bycatch of marine mammals, seabirds and sharks is an issue often highlighted in the media, invertebrates and non-target fish species are also caught as bycatch (including protected species). There is significant bycatch of non-target species every year – much of which is dead on recovery or killed by predators if returned to the ocean.[88–90] While there can be direct mortality (e.g. death from crushing or drowning in trawls, entanglement in longlines), individuals may survive the initial capture but have variable levels of survivability on release due to injury or shock.
Key bycatch of commercial fishing effort includes:
- Non-target fish and invertebrates (includes some protected species),
- Sharks, rays and chimaeras (includes some protected species),
- Seabirds (protected, except black-backed gulls/karoro),[91] and
- Marine mammals (protected).
Non-target fish can include those that are desirable commercial species but are undersized (not able to be legally landed) or those for which fishers do not have ACE. Issues relating to discards of non-target fish are discussed in a later section.
Innovative approaches to reduce bycatch and avoid interaction with protected species are included in ‘How we fish’ and ‘Where and when we fish’.

Mixed species bycatch from a deepwater trawl. Image credit: MPI/NIWA.
There is significant bycatch of non-target species every year – much of which is dead on recovery or killed by predators if returned to the ocean.
Data collection
Bycatch and discards data currently relies heavily on observer coverage and may sometimes assume there is no difference in fishing practices between observed and fishing trips.[92] However, this is not the case.[93–97] Observed bycatch is consistently much greater than that self-reported by fishers, which needs to be accounted for when interpreting bycatch data.
Observed bycatch is consistently much greater than that self-reported by fishers.
While protected species impacted by fisheries activities have been studied, this research and assessment is also impacted by wider issues in fisheries data collection and reporting (discussed in the section ‘Data transformation strategy’). Issues include electronic reporting data from observers not being directly included in the Centralised Observer Database, and errors in how data is entered and linked.[98] Multiple organisations could benefit from working with observer capture data, so developing collaborative working methods would be beneficial for consistency, reliability and timeliness of protected species bycatch data.[99] Some government organisations do already work together through the Marine Hub (a policy development and advice group).
Most ecological risk assessments in Aotearoa New Zealand have been qualitative or semi-quantitative, which points to a lack of comprehensive or in-depth data being available. Actively seeking this information should be an integral part of the stock assessment process.
In general, most ecological risk assessments undertaken for Aotearoa New Zealand fisheries have been qualitative or semi-quantitative[100], which points to a lack of comprehensive or in-depth data being available. Actively seeking this information should be an integral part of the stock assessment process, which currently has a single-species focus, as discussed in the section ‘Setting catch limits and allocating catch allowance’. The most recent assessments for marine mammals and seabirds do include quantitative risk assessments, but note areas where little quantitative information is available. For example, potentially key threats to Hector’s and Māui dolphins such as climate change effects and seismic disturbance were not addressed quantitatively[101]; there was little quantitative information to inform cryptic mortality for seabirds[102], and Abraham et al. [103] noted in the Assessment of the risk to New Zealand marine mammals from commercial fisheries that “for most species, the assessment relied on expert judgement to derive distributions for marine mammals. A quantitative analysis of the distribution of New Zealand marine mammals would help improve the estimation of fisheries-related fatalities.”
Long-term datasets on bycatch species, outside of landings, is an area that could be improved for many species and locations. One-off surveys may be the only historical data in many cases. While these datasets are very valuable, access could reportedly be improved to facilitate more analysis of this data.[1, 104, 105] This is discussed further below.
These considerations underpin recommendations in Themes 5 and 6.
Current reporting and performance
Issues relating to bycatch are detailed every year by Fisheries New Zealand in their AEBAR,[106] so a comprehensive discussion of bycatch is available for analysis in those reports. The boxes below summarise information Fisheries New Zealand presents as ‘Indicators and Trends’ in the 2019-2020 AEBAR.
Non-target fish and invertebrate catch
| Indicator | Measurement | Summary extracted from MPI [107] |
|---|---|---|
| Annual discards as a fraction of the catch of the target species. | Mean discard fraction. | Largest mean discard fraction – scampi (Metanephrops challengeri) trawl fishery, 3.8 kg of bycatch is discarded for every kg of scampi caught. Smallest discard fraction – oreo*, jack mackerel/hautere (Trachurus symmetricus), and southern blue whiting (Micromesistius australis pallidus) fisheries (0.01 kg). Trends are provided for some individual fisheries. *Includes three species managed as one stock: black oreo (Allocytus niger), spiky oreo (Neocyttus rhomboidalis) and smooth oreo (Pseudocyttus maculatus). |
Sharks, rays and chimaeras (Chondrichthyans)
| Indicator | Measurement | Summary extracted from MPI[107] |
|---|---|---|
| Risk assessment and threatened species classification | Qualitative risk assessment and CPUE analysis for some QMS stocks; Qualitative risk assessment and relative biomass trends for some non-QMS species. | There are 11 species of sharks in the QMS. CPUE analysis has been completed for six species only. School shark/tope (Galeorhinus galeus) and elephant fish/makorepe (Callorhinchus milii) are declining in some areas, but all others are stable or increasing. Trends in abundance of eight non-QMS species provided are mostly stable or increasing, except for the pale ghost shark (Hydrolagus bemisi). Some species are classified as threatened or endangered. |
Seabirds
| Indicator | Measurement | Summary extracted from MPI[107] |
|---|---|---|
| Population size | Periodic estimate (2000). | Not reported: multiple species.[108] |
| Population trend | Periodic estimate (2000). | Not reported: multiple species.[108] |
| Threat status | Multiple species (NZ threat status updated 2017). | Not reported: multiple species.[109] Many species are classified as threatened or endangered. |
| Number of interactions | Estimated captures by bird group and fishery. | In 2017-2018 an estimated 3,329 seabirds were captured. |
| Trends in interactions | Estimates captures by bird group. | Total captures of all seabirds show a decreasing trend between 2002-3 and 2016-17, except for white‐chinned petrel (Procellaria aequinoctialis). Detail provided for several seabird species. A quantitative spatially explicit risk assessment (completed in 2020) ranks the risks to each seabird species or group. |
NZ sea lion/rāpoka
| Indicator | Measurement | Summary extracted from MPI[107] |
|---|---|---|
| Population size | Periodic estimates, Department of Conservation unpublished data. | Total population size in 2016: 11,755 New Zealand sea lions (Phocarctos hookeri) including pups. Number of pups born in 2019-20: Maungahuka Auckland Islands – 1,740; Motu Ihupuku Campbell Island – 595; Rakiura Stewart Island – 48; and Otago Coast – 21. |
| Population trend | Time series (1990-2020) of estimated annual pup production at Maungahuka the Auckland Islands, Motu Ihupuku Campbell Island, Rakiura Stewart Island, and New Zealand South Island, variable number of data points depending on location. | Annual pup production generally increasing (NZ Mainland, Rakiura Stewart Island, Motu Ihupuku Campbell Island). Maungahuka Auckland Island previously decreasing, more stable since 2010. |
| Threat status | New Zealand/IUCN threat status. | Nationally Vulnerable/Endangered. |
| Number of captures | Observed captures in trawl fisheries from 2016-2019. | Three observed captures in trawl fisheries in 2016-17. Seven observed captures in trawl fisheries in 2017-18. Seven observed captures in trawl fisheries in 2018-19. |
| Trends in observed captures (both sexes) | Graph showing observed captures across all Maungahuka Auckland Islands trawl fisheries (dead or alive) by sex from 1992-2020. | Observed captures have trended down since 2000-2001 but increased slightly in 2016-2019. |
| Trends in estimated deaths (females only) | From [110] Graph showing annual estimate of female deaths across SQU, SCI, OTH fisheries from 1993-2017. | Estimated deaths (females only) have trended down since 1993, with an increase in the years between 2002 and 2006. Spatially explicit risk assessments identify spikes in risk to females in the bottom trawl squid fishery 1994-97 and 2005-6. |
NZ fur seal/kekeno
| Indicator | Measurement | Summary extracted from MPI[107] |
|---|---|---|
| Population | Unknown. Rough estimate from papers 20-30 years ago. | Unknown, potentially 100,000 fur seals (Arctocephalus forsteri) in New Zealand EEZ. |
| Population trend | Commentary. Trends known for some mainland colonies but not for offshore island colonies. | Increasing at some mainland colonies. Range thought to be increasing. |
| Threat status | New Zealand/IUCN threat status. | Not Threatened/Least Concern. |
| Number of interactions | Estimated captures in 2015/2016. Observed captures in 2017/2018. Estimated annual potential fatalities.[103] | Trawl fisheries: 80 observed catches (2017-18), 375 estimated captures (2015-16). Surface‐longline fisheries: 12 observed captures (2017-18), 24 estimate captures (2015-16). All fisheries: 949 estimated annual potential fatalities (2017). |
| Trends in interactions | Trawl fisheries observed captures (dead, alive, and rate per tows) and proportion of tows observed (2003-2018). Surface-longline fisheries observed captures (dead, alive, and rate per hooks) (2003-2018) and estimated captures (2003-2016). | In trawl fisheries, the rate of observed captures has decreased over time while observer coverage has increased. In surface-longline fisheries, the rate of observed captures has seemed to trend up from 2009 (rate of observer coverage not shown) and possibly dropping from 2015. Estimated captures are around four to seven times higher than observed captures. |
Hector's dolphin and Māui dolphin
| Indicator | Measurement | Summary extracted from MPI[107] |
|---|---|---|
| Population size | Hector’s dolphin: annual estimates for east coast, west coast and south coast of South Island. Māui dolphin: periodic estimates (2011, 2015). | Hector’s dolphin: median estimates of 8,968 (East Coast SouthIsland.), 5,388 (West Coast South Island), 217-508 (95% c.i. South Coast South Island) & unknown (North Coast S.I). Māui dolphin: 63 (in 2015-2016), 55 (in 2010-2011). Note these numbers are contested.[111] |
| Population trend | Hector’s dolphin: Unknown. Māui dolphin: Periodic estimates. | Hector’s dolphin: Unknown (inconsistent evidence, uncertainty). Māui dolphin: Declining over longer period, possible stabilization in recent years. |
| Threat status | New Zealand/IUCN threat status. | Hector’s dolphin: Nationally Vulnerable/Endangered. Māui dolphin: Nationally Critical/Critically Endangered. |
| Number of fisheries deaths (includes cryptic deaths) | A spatially explicit risk assessment is used to estimate the risks from different threats, including fishing.[101] Only fisheries observer data are used as inputs to the model. | Hector’s dolphin: set nets (estimated 44), trawl (estimated 14). Māui dolphin: set nets (estimated 0.10), trawl (estimated 0.02). |
| Trends in interactions | Commentary. | Hector’s dolphin: set net stable, trawl decreasing. Māui dolphin: set net decreasing, trawl decreasing. Note that in late 2020, bans on trawling and set nets around much of the South Island and the West Coast of the North Island were extended. |
Common dolphin/aihe
| Indicator | Measurement | Summary extracted from MPI[107] |
|---|---|---|
| Population size | No measurement. | Unknown in Aotearoa New Zealand but 4,000,000 common dolphins (Delphinus delphis) worldwide. |
| Population trend | Unknown. | Unknown. |
| Threat status | New Zealand/IUCN threat status. | Not threatened; data poor, and secure overseas (2013). IUCN: Least Concern. |
| Number of interactions | Periodic estimated and observed captures. | Most recent estimates in 2017 of 143 annual potential fatalities. One observed capture in trawl fishery in 2017-2018. |
| Trends in interactions | Graphs of observed captures (dead, alive, rate per tows) (2003-2018) and estimated captures (2003-2015). | Captures have decreased in the jack mackerel trawl fishery since 2003. Captures in trawl fisheries have fluctuated since 2003. |
In general, there are many areas where data is not available and conclusions cannot be drawn regarding trends. Further discussion is provided for the following categories, by way of example.
Non-target fish and invertebrates
 While many non-target species sit within the QMS, they may not be assessed at all if they are considered nominal stocks (see section on nominal stocks) or may not be scientifically evaluated if data is lacking.
Non-target fish species are less studied in general so non-direct impacts on stocks and sustainability are also not well understood. For example, the impact of marine reserves on non-target species has not been the focus of monitoring surveys.[112] While ecosystem change is a common threat to species recovery, often very little is known about the species themselves.[113] In Aotearoa New Zealand, deepwater surveys catch and record data on 200-300 species and inshore surveys catch and record data for 120-140 species (although not in all areas, e.g. north-east North Island). However, only data for key survey species is used routinely for stock assessment. Consequently, even where data may be available there is a lack of knowledge in this area.
Fisheries New Zealand reports in the AEBAR (2020) that there are “trends showing increased rates and levels of catch and discarding of several non‐target species or species categories, especially some non‐QMS fish species and invertebrates”.[107]
Trends showing increased rates and levels of catch and discarding of several non‐target species or species categories, especially some non‐QMS fish species and invertebrates.”
– AEBAR 2020.
Coral, most species of which are protected under the Wildlife Act 1953, occur as bycatch, particularly in deepwater bottom trawling fisheries and with dredging.[114] Any protected coral accidentally brought to the surface must be immediately returned to the sea. Corals that are habitat-forming can also provide important habitat for other species and coral communities are slow to recover from fishing impact (discussed further in ‘Habitat’ section).
Sharks, rays and chimaeras
 While some shark species are target stocks for commercial fisheries, others are non-target or protected but may be incidentally caught in fishing gear given the significant overlap of sharks and fishing effort.[115–117]
Sharks are a significant player in marine ecosystems as an apex predator and control populations of other species. Their niche is similar to tuna, so they can often be caught in commercial (and recreational) fisheries targeting tuna stocks. However, there is reportedly very little knowledge on sharks in Aotearoa New Zealand.[118, 119] Choosing the most appropriate management approach for conservation of sharks is heavily dependent on our knowledge, much of which comes from commercial fisheries reporting.[120]
Choosing the most appropriate management approach for conservation of sharks is heavily dependent on our knowledge, much of which comes from commercial fisheries reporting.
There is a National Plan of Action for the Conservation and Management of Sharks, which focuses on conserving and managing sharks taken in Aotearoa New Zealand fisheries. This plan differs from others in that some shark species are commercially-targeted (e.g. rig/spotted dogfish[121], school shark and elephant fish). There are also regular risk assessments of commercial fishing to New Zealand chondrichthyans (which includes sharks and other cartilaginous fishes like rays).[100] While the risk assessment states that “available information did not suggest that commercial fishing is currently causing, or in the near future could cause, serious unsustainable impacts”, it also states that there was low confidence in many of the risk scores. The risk assessment was qualitative, though it notes that the increasing amount of data means quantitative techniques could be applied to some shark species in the medium term to improve assessment of fisheries risk to those species. The assessment also identifies short-term opportunities that can be taken for some species including:
- Reviewing data that has already been collected from trawl surveys (such as catch rates and biological information).
- Analysing overlap between fisheries activity and shark distribution range at a finer scale.
- Undertaking biological studies to improve estimates of population parameters.
- Developing indicators of abundance for species where this is currently lacking.
- Increasing taxonomic or observer education on identifying sharks.
These are opportunities that could be applied to many species to make better use of available information and to strengthen data collection methods. There is reportedly an improved risk assessment process being planned under the next shark National Plan of Action, as the plan is currently being advised and updated.[122]
Other gaps are in understanding of post-release mortality of some shark species.[115] While targeted research on some shark species is likely to be difficult and expensive, Francis[116] recommends increasing biological data take from bycatch and tagging of sharks to increase information on movements and stock range. Research that has already been undertaken includes tagging of great white sharks/mangō-taniwha[123] using a range of techniques since 2005.[124] This has helped us build our understanding of large-scale migration patterns and sets a foundation for more targeted research, such as identifying hotspots of abundance.[115] An environmental DNA study was undertaken in California to inform fisheries management of great white sharks in real time; similar approaches could provide opportunities for conservation efforts in Aotearoa New Zealand (see case study: Managing great white shark conservation through eDNA).
Seabirds
 There is a National Plan of Action to reduce the incidental catch of seabirds in New Zealand fisheries, which has been updated in 2020.[125, 126] The vision for the plan is to work towards zero fishing-related seabird mortalities and has eleven measurable objectives to work towards achieving the plan’s goals. The ministries describe understanding how seabirds and fisheries interact, and what impact this has on seabird population trends, as an ongoing challenge.[126] There has also been a substantial update to seabird chapters in the AEBAR 2019-2020.
Fisheries New Zealand and the Department of Conservation expect the use of digital monitoring, geospatial position reporting and electronic reporting on all commercial vessels, as well as cameras on vessels to greatly improve information on seabird capture in fisheries. In a later section, we discuss how digital monitoring is expected to substantively change how fisheries are monitored in Aotearoa New Zealand and how it will improve information on seabird capture events across a broad range of fisheries.
The latest risk assessment of commercial fishing to Aotearoa New Zealand seabirds was published in 2020.[102] The risk assessment is based on the spatial overlap between seabird and fishing effort distributions, and the probability of incidental capture or death, and uses observer records on incidental captures on-board commercial fishing vessels. The risk assessment reported that black petrel/tāiko[127] were at “very high risk” from commercial fisheries (see case study: A collaborative effort to protect vulnerable seabirds), and five species were at “high risk” from commercial fisheries (Salvin’s albatross/toroa[128], Westland petrel/taiko[129], flesh-footed shearwater/toanui[130], southern Buller’s albatross/toroa[131] and Gibson’s/Antipodean albatross[132]).
Observer coverage at the level undertaken in Aotearoa New Zealand is unlikely to detect captures of very rare species, cannot effectively quantify seabird capture, and is not particularly representative (e.g. seasonality, vessel characteristics, location)[133]. For example, less than 2% of trawl tows were observed in inshore fisheries in 2009-2010.[107, 134]
Observer coverage at the level undertaken in Aotearoa New Zealand is unlikely to detect captures of very rare species, cannot effectively quantify seabird capture, and is not particularly representative.
Non-governmental organisations have advocated for a zero-bycatch goal, with gear innovations to reduce seabird capture a key component of achieving this.[135] Efforts to design and deploy such gear are discussed in the sections ‘How we fish’ and ‘Where and when we fish’.
Marine mammals
 Marine mammals are much more studied than many other non-target species – particularly our threatened Aotearoa New Zealand species.[136] The latest assessment of risk from commercial fisheries to all marine mammals was undertaken in 2017,[103] there has also been more recent risk assessments for Hector’s and Māui dolphins[101] and New Zealand sea lion.[137]
There is a New Zealand sea lion Threat Management Plan, and a Hector’s and Māui dolphins Threat Management Plan has been in place since 2008 and in 2020 a new plan was proposed and implemented.[138] Mitigating interactions with commercial fisheries is a key aspect of the sea lion plan alongside the need for a more holistic approach to manage other threats to sea lions. For the dolphin plan, the objectives include that dolphin deaths from fisheries threats do not exceed population sustainability thresholds, cause localised depletion; or create substantial barriers to dispersal or connectivity between subpopulations.
Though there is a lot of research on these species, there are still research objectives to improve information on fisheries impacts and make data more easily accessible.[138, 139]
Protected species bycatch in commercial fisheries has trended down over time, though continued measurement effort is needed to verify these trends.[140] It is hard to distinguish between reduction in catch being due to the reduction of populations or due to changes in technology and practices in fisheries, so this is a contested area.
It is hard to distinguish between reduction in catch being due to the reduction of populations or due to changes in technology and practices in fisheries, so this is a contested area.
Habitat
Fishing impacts on habitat
 Fishing can cause both direct and indirect impacts to marine habitat. One of the most obvious impacts is when benthic trawling is undertaken. In this fishing method, nets are weighted so they drag along the seafloor and this causes damage to the marine environment. In the 2019-2020 fishing year, 46% of our catch volume was caught through bottom trawling.[141] Biogenic habitat (composed of living groups such as corals) are often significant habitats for fish and invertebrate species, particularly in juvenile life stages.[142] Even decades after bottom trawling has been halted, there can be little to no recovery in a benthic community.[143, 144]
In the 2019-2020 fishing year, 46% of our catch volume was caught through bottom trawling.
The impacts of bottom trawling are highly context dependent, and depend on variables such as location, substrate, presence of vulnerable biota, scale, frequency, duration, intensity, and how it is deployed (read more about currently used fishing methods and a later section that covers gear innovations in progress).[142, 145]
Even decades after bottom trawling has been halted, there can be little to no recovery in a benthic community.
Benthic trawling is used for a wide variety of fisheries both in the deepwater and inshore fisheries. Bottom trawling allows large quantities of fish that live on or near the seabed to be caught in one trawl. However, bottom trawling can also damage fragile sea life such as corals and sponges that provide habitat for fish species, some of which are protected (see ‘Current reporting and performance’). Seamounts and other underwater hills or knolls are often a haven for these fragile habitats and can be targeted by fishing as they are highly productive areas and are home to many commercial fish species. Fishers do not target hard surfaces for bottom trawling to avoid losing gear and catch.[146] Dredging similarly damages benthic habitat and is generally used in harvesting shellfish like scallops and Bluff oysters.[147, 148] Certain areas of habitat are of particular importance to specific fisheries, while others may be of importance to non-target species and support ecosystem health.
There are also impacts related to the sediment that is released from gear contacting the seabed. For example, these plumes can smother corals and plug polyps, affecting their ability to feed.[142]
While direct impacts can be more easily studied and understood, there are more complex and significant knowledge gaps. There is a lack of understanding of resilience and recovery dynamics of deep-sea and coastal habitats impacted by benthic trawling.[144] Little is known about how the functioning of our ecosystems (and the benefits we gain from them) is impacted by changes to seabed habitats, including productivity on continental shelves and benthic habitats of significance.[23, 24] These issues are discussed further in the section below on food webs.
There are many examples of the impacts of bottom-disturbing fishing methods on the habitat of a target stock. The Challenger Scallop fishery (SCA7) is one such stock – located in Tasman and Golden Bays. In the late 1950s, commercial dredging for scallops began and peaked at 10,000 tonnes in 1975.[149] The fishery then rapidly declined and closed for two years in the 1980s. Despite a short-lived recovery in the 1990s (though reaching only half of the volumes harvested in the 70s), the fishery has never recovered, even with enhancement activities being undertaken (such as reseeding populations with scallop spat). Other factors, such as sediment flows into the bays (and consequent suspended sediment), may also be contributing to the lack of substantial recovery over time, despite intense management and fishery enhancement efforts.[150] As referenced in the section ‘Managing stocks with incomplete data’, in 2020 a Southern Scallop Strategy was implemented for SCA7, which acknowledged there has been little evidence to suggest the resource is recovering and that a fresh approach is needed.
Because of the known impacts, bottom trawling and dredging are banned in some ecologically important areas of Aotearoa New Zealand’s seas.

New Zealand scallop (Pecten novaezelandiae). Image credit: jacqui-nz/iNaturalist NZ (CC BY-NC 4.0).
This discussion underpins our recommendations in Theme 6.
Data collection, reporting and performance
When it comes to the seafloor, around 15% of Aotearoa New Zealand’s marine environment has been swath-mapped to a level that lets us define the seabed habitat, in a publicly accessible format,[151] though efforts are underway to map more of the ocean as part of an ambitious international project to map the entire ocean floor by 2030.
Swath-mapping is a type of acoustic scanning that helps to define seabed habitats on a large scale. Beams of soundwaves are reflected off the seafloor and the strength of the echoes indicate the hardness and texture of the habitat. In order to observe patterns – whether there are improvements or declines – we require adequate detail, comprehensive and consistent data and time series.[152, 153]
This leaves 85% of Aotearoa New Zealand’s seabed habitat largely unmapped. Where we do have knowledge about the characteristics and extent of habitats that are of significance to species and to fisheries it can then allow us to manage these habitats appropriately.[1, 22] We have opportunities to increase our knowledge in this area to improve our understanding of where further management responses might usefully apply. The Ocean Survey 20/20 programme aimed to provide better knowledge of our ocean territory (coordinated by Land Information New New Zealand (LINZ)). The first survey in this programme was undertaken between 2008 and 2010 of the Peiwhairangi Bay of Islands coast. However, the programme was discontinued, as the National Marine Research Strategy for the Natural Resources Sector was developed.[154]

Industry also collects data about the seafloor, although this is not publicly available. There is an untapped data resource here that could be aggregated (once data has been desensitised) to get a better picture of our benthic habitats and geography.
Industry also collects data about the seafloor, although this is not publicly available. There is an untapped data resource here that could be aggregated (once data has been desensitised) to get a better picture of our benthic habitats and geography.
This underpins recommendations in Theme 5.
In 2007, around one third of Aotearoa New Zealand’s deep sea benthic areas became protected from bottom trawling in an agreement between industry and government.[155] These BPAs provide protection for some ecologically important habitats that are within trawling depth. The degree of protection afforded by these BPAs is fiercely contested. Industry argue that when the BPAs were first established they endeavoured for them to be representative of Marine Environment Classifications, geologic regions, depth ranges, and underwater topographical features.[155] Others contest this, arguing that much of the protected area may have little benthic habitat of importance to commercial fisheries and may not be suitable for benthic trawling regardless of the protections provided – for example, areas may be too deep to bottom trawl.[156–159] Work on marine environment classification is ongoing and best available information continues to evolve.
The degree of protection provided by these BPAs is fiercely contested.
The total annual area of the seafloor that is bottom-trawled is not increasing and has remained under 100,000 km² per year over the last decade. However, each year new areas are trawled (see appendix 3).
Over the last 20 years, the annual expansion of the cumulative trawl footprint in the deepwater fisheries has slowed, from around 1,000 km² in 2002 to under 100 km² in 2019. However, the overall ‘cumulative trawl footprint’ in deepwater fisheries (the total area of our seafloor that has ever been trawled) is still increasing. This is a concern given the long time for recovery of some fragile seafloor habitats (see ‘Habitat’ section). Understanding the extent and patterns of contact with newly trawled compared to previously trawled areas, the habitats and species impacted, and the recovery time for the area trawled, are important factors in understanding the nature of benthic damage from trawling activities in our waters.
The schematic figure illustrates the principle and approximate scale, which are not contested. The precise figures for the annual increase in the cumulative trawl footprint are hard to measure and the most recent data for both deepwater fisheries and inshore fisheries held by Fisheries New Zealand is appended are included in appendix 3.[160] Note that elements of the data remain a matter of dispute, for example from WWF.
The way that areas that are ‘newly trawled’ are estimated can differ depending on the starting point of the data (e.g. how far back records go) and the level of information available (e.g. how precise location data is).[161] The resulting estimates can vary depending on how the analysis is undertaken. Where large areas have clearly been newly explored, these are generally highlighted in Fisheries New Zealand research and reporting (see for example, [162]). In recent years, this has been mainly in the north and central areas of the Challenger Plateau. The use of electronic positioning reporting data in 2018 and 2019 has allowed for more precision in locating the start and end positions of tows, which has consequently affected standard reporting measures used by Fisheries New Zealand.[163] Further linking of observer data with electronic positioning reporting data will advance understanding of the habitats and species that are being impacted in the newly trawled regions.

Figure taken from AEBAR 2020, see Figure 11.13 Annual footprint (km²) for bottom‐contacting trawling for inshore and deepwater fish stocks, from TCERs, TCEPRs, and ERS, for the 2007-08 (2008) to 2017-18 (2018) fishing years.[159]

Schematic to demonstrate how a trend in decreasing amount of newly trawled areas (a) still increases the cumulative trawl footprint (b). (Schematic used as the data is disputed but the principle is not).
There is a lack of agreement in the approach to assess impacts. Internationally, indicators for assessing impacts of trawling and dredging have been proposed by many but have not been evaluated or agreed upon.[164] This is reflected in Aotearoa New Zealand where the approach to assessment[165] is not accepted by all stakeholders and opinions on the value of the assessments differ. Aotearoa New Zealand’s assessment processes lag behind best practice and we are limited by our lack of data.[166]
Aotearoa New Zealand’s assessment processes lag behind best practice and we are limited by our lack of data.
Habitat information is provided by Fisheries New Zealand in the AEBAR.[105] Habitats of particular significance for fisheries management (HPSFM) are included in Section 9(c) Environmental Principles of the Fisheries Act 1996, but have not been used to protect habitats. While there have been no HPSFM formally identified (see section on HPSFM and table ‘Measurements and assessments of habitats taken from the 2019-2020 AEBAR’ below), other legislative tools have been used (discussed further in the section ‘Managing impacts through protection tools’) and area-based management tools that have been implemented under the Fisheries Act 1996. Further information is included in appendix 4: Land-based effects data.
The table ‘Summary of the environmental reporting on habitat from Our Marine Environment 2019‘ below highlights environmental areas of concern and summarises the Ministry for the Environment’s marine environmental reporting in these areas. This is not a comprehensive summary of all environmental information available – it is to show what information is analysed and presented within the current environmental reporting framework. All summaries are based on a compilation of available data and literature review.
A review of Aotearoa New Zealand’s key biogenic habitats in 2019 presented available information on 15 key biogenic habitats in our waters.[167] The review identified significant and extensive data gaps on where these habitats occur in Aotearoa New Zealand as well as the absence of baseline and temporal monitoring surveys for most biogenic habitats. The focus on biogenic habitat also excludes much of the seabed habitat (noting this habitat is not typically defined as sensitive).[151] Note that if the indicator is stable then it does not necessarily mean it is at a healthy level.
The review identified significant and extensive data gaps on where these habitats occur in Aotearoa New Zealand as well as the absence of baseline and temporal monitoring surveys for most biogenic habitats.
Measurements and assessments of habitats taken from the 2019-2020 AEBAR.
| Indicator | Measurement | Summary extracted from MPI[106] |
|---|---|---|
| Benthic impacts | ||
| Annual number of tows | Annual reporting | 2017-18: 65,133 trawl tows, 50,288 shellfish dredge tows. |
| Trend in number of tows | Total reported trawls by fishing year (1990-2018) by reporting mechanism. Number of dredge tows by fishing year (1990-2018) by fishery (SCA, OYS). | Number of trawls and dredge tows have decreased over the last 30 years, more significantly for dredge tows. |
| Cumulative overlap of trawl footprint with benthic‐optimised marine environment classification (BOMEC) habitat classes for 2007-08 to 2017-18 | BOMEC class, total area, area open to bottom fishing, deepwater footprint area, inshore footprint area (total over ten year period). | Total area trawled between 2007 and 2017 is 2.7 million km². The footprint area (as % of total marine area) is around 7% for deepwater and 6% for inshore. |
| Habitats of particular significance for fisheries management | ||
| No ‘Habitats of Particular Significance for Fisheries Management Habitat’ (HPSFM). | N/A | N/A (see section on HPSFM) |
Summary of the environmental reporting on habitat from Our Marine Environment 2019.
| Habitat | 2018/2019 Summary |
|---|---|
| Seagrass meadows | Decreased but predicted stable or increase (good to moderate confidence in data). |
| Mangrove forests | Increased and predicted to increase (good confidence in data). |
| Kelp forests | Remained stable and predicted to remain stable although vulnerable (good confidence in data). |
| Bryozoan thickets | Decreased and predicted to continue to decrease (moderate to low confidence in data). |
| Stony coral | Stable or decreased and predicted to remain stable or decrease (good to moderate confidence in data). |
| Beds of large shellfish | Decreased and predicted to continue to decrease (good to moderate confidence in data). |
| Calcerous tubeworm mounds | Stable and predicted to remain stable or decrease (good confidence in data). |
In 2014, Morrison et al. undertook a study of areas of particular significance for finfish fisheries management in Aotearoa New Zealand.[168] The review finds that despite decades of fisheries research, knowledge of habitats of significance is low due to our modest understanding of fish species’ life histories, habitat usage and spatial structuring. Filling these information gaps is framed in the review as an issue that is not fixable in the short-to-medium term and that applying limited resources for increased science understanding and management is “only in part a science question: social and political pressures will also strongly drive such decisions.” The ‘habitat’ section of AEBAR was not updated in the 2019-20 edition.
Despite decades of fisheries research, knowledge of habitats of significance is low due to our modest understanding of fish species life histories, habitat usage and spatial structuring.
There are maps that show approximate and broadly classified habitats. However, when this is compared to more detailed surveys of a particular area it becomes apparent how imprecise these classifications are.[169]
As recently as 2020, Waikato Regional Council commented that the data management for habitat information was unhelpful as data sources were held by many different organisations; data was stored in many different formats; and metadata was often lost, making the data much less useful.
There is a national marine coastal habitat geographic information system (GIS) layer that gives a high-level view, but does not incorporate detailed local information (such as that held by regional councils). NIWA has recently undertaken research for the Department of Conservation (with the Ministry for Primary Industries and the Ministry for the Environment) that outlines some of the issues with current Aotearoa New Zealand habitat mapping schemes. As recently as 2020, Waikato Regional Council commented that the data management for habitat information was unhelpful as data sources were held by many different organisations; data was stored in many different formats; and metadata was often lost, making the data much less useful.
The council states that a “concerted effort is needed (across Aotearoa New Zealand) to catalogue what exists and to collate and store this data appropriately”.[170] This is not a new issue as it is known that much detailed information from regional surveys is not recorded in the national habitat map.[169] This detailed information is much more useful when planning for marine protection, particularly when habitat mapping is combined with other information like video surveys (see section ‘Underwater and surface cameras give a wider and sharper view of the ocean’) or benthic sampling.
Aotearoa New Zealand has several marine environment classification systems with iterations over time:
- Marine Environment Classification (MEC) – 20 class levels. This is used for both pelagic and benthic elements of marine ecosystems.
- Benthic Optimised Marine Environment Classification (BOMEC) – 15 class levels to show differences in benthic community composition (up to 2,000 m depth). Developed in 2012 for Aotearoa New Zealand waters.[171]
- National Coastal Marine Habitat Classification (2011)/New Zealand Marine Habitat Classification Scheme (2013).
- Various classifications for demersal fish.[172–174]
- Newly developed national seafloor classification by the Department of Conservation.
While BOMEC and MEC can be broadly consistent at a large scale (e.g. over hundreds of kilometres), they are not reliable at a finer scale.[175] This is an area where consistency across the marine domain through harmonisation of classification and agreement on high-level principles and definitions would be beneficial.
This discussion underpins recommendations in Themes 2 and 6.
A 2019 review undertaken by NIWA for the Ministry for the Environment found there are extensive and significant data gaps on where biogenic habitats occur.[167] While there are national databases for two types of biogenic habitat (seagrass and mangroves), there are another 13 habitats for which this national inventory is missing.[167] These are kelp forests, algal meadows, rhodolith beds, bryozoan thickets, sponge gardens, shellfish beds, non-calcareous tubeworm fields, calcareous tubeworm mounds, deep-sea chemoautotrophic tubeworm patches, stony-coral thickets, bush coral fields, sea pen fields and xenophyophore beds. Value could be gained by compiling existing data into a national dataset.
Value could be gained by compiling existing data into a national dataset.
Councils may undertake mapping for a variety of purposes, including navigation safety purposes (updating charts), as well as protecting marine biodiversity. Geospatial position reporting (GPR) data identifies where fishing has occurred and whether vessels have gone to new areas, but it is not linked to observer data. If linked data such as benthic bycatch, this could show which areas are more sensitive and vulnerable to practices like trawling, noting that the degree to which this tool can identify sensitive habitat is only as good as the data.
There are extensive and significant data gaps on where biogenic habitats occur. While there are national databases for seagrass and mangroves, there are another 13 habitats for which a national inventory is missing.
Seabed that has been mapped at a finer detail (in the last decade) includes:
- Peiwhairangi Bay of Islands (East Northland)
- Raukawa Moana Cook Strait and Te Ara-a-Kiwa Foveaux Strait (LINZ shipping lane surveys)
- 6,000 hectares of seabed habitat northeast of Rangitoto ki te Tonga D’Urville Island (NIWA for Marlborough District Council)
- 43,000 hectares of seabed habitat in Tōtara-nui Queen Charlotte Sound, involving two vessels and 280 days on the water (NIWA and Discovery Marine Ltd for Marlborough District Council).[168]

Rhodolith beds at the Te Miko Reef, Peiwhairangi Bay of Islands. Image credit: Roberta D’Archino.

Diver in a Macrocystis kelp forest, Otago. Image credit: Chris Hepburn.
This discussion underpins recommendations in Themes 6 and 7.
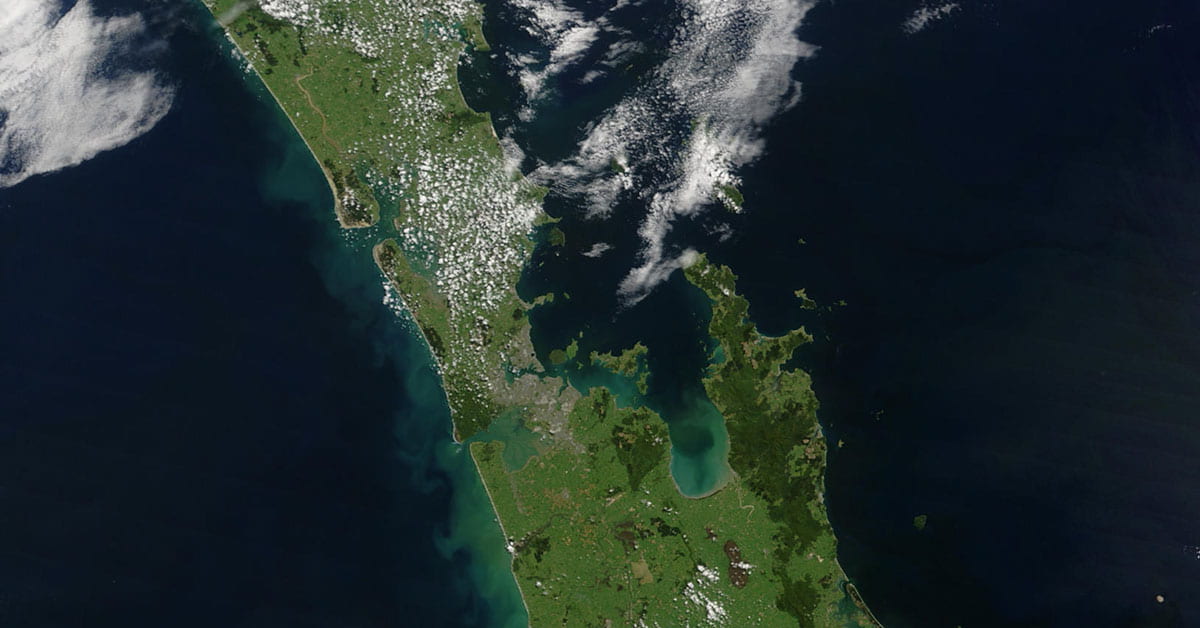
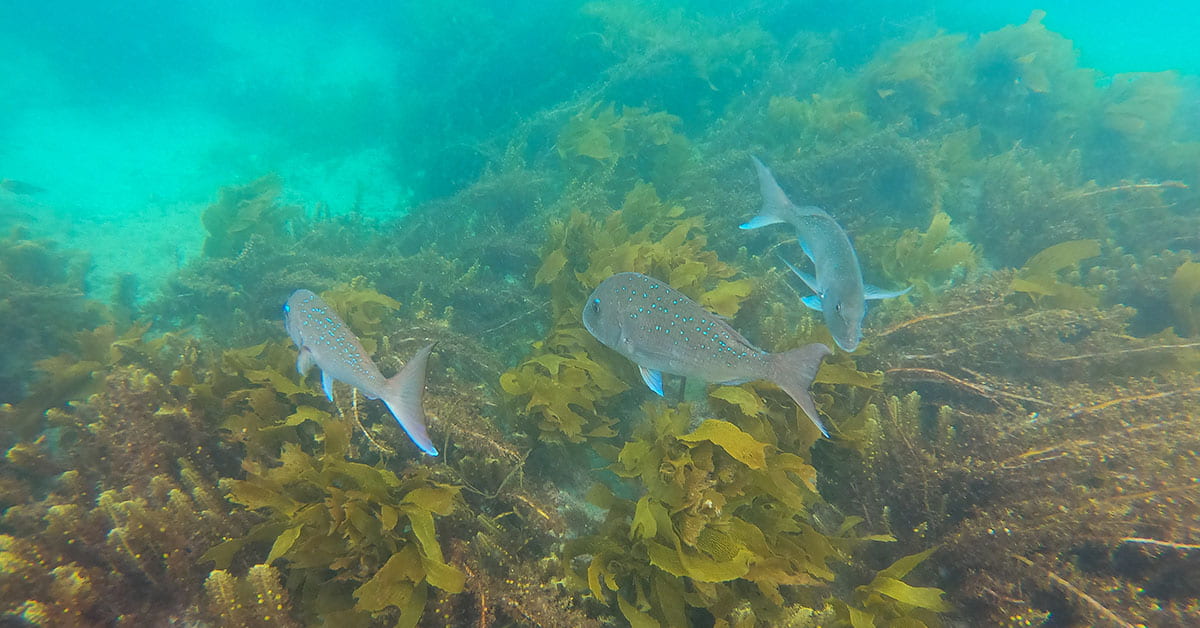
Ecosystem structure and function
Our marine ecosystem is comprised of the fish we target, other living animals (‘Bycatch’ section), and both living and non-living habitat (‘Habitat’ section).[177] Ecosystems are complex and can be difficult to understand yet maintaining good function in ecosystems is central for the continual provision of ecosystem services. These include, for example:[178]
- Goods such as fish harvests, wild plants and animals, raw materials, genetic materials and water.
- Services such as recreation, tourism, transportation, pollution control, nutrient cycling, water filtration, storm and shoreline protection, and carbon sequestration.
- Cultural benefits such as preservation for future generations and for its cultural significance.
Aside from stock depletion and habitat impacts, overfishing can result in significant changes to community structures.[179] There is a need for ways to measure the broad ecosystem level effects of fishing activities as a whole in order to sustainably manage fisheries.
There is a need for ways to measure the broad ecosystem level effects of fishing activities as a whole in order to sustainably manage fisheries.
In order to implement ecosystem-based approaches to fisheries management, we need to understand how ecosystems operate and be able to identify indicators to protect their function as part of fisheries management. Currently, we tend to wait for adverse impacts to materialise before implementing management responses and often struggle to respond. Ideally, we would pre-empt negative impacts via a thorough understanding of how ecosystems function.

Macrocystis kelp forest, Kau Bay, Wellington. Image credit: Nicole Miller.
Currently, we tend to wait for adverse impacts to materialise before implementing management responses and often struggle to respond. Ideally, we would pre-empt negative impacts via a thorough understanding of how ecosystems function.
Biodiversity in our marine environment
Research suggests that ecosystems with greater biodiversity may be more resilient to ecosystem changes.[180–183]
There are still many knowledge gaps around the impact of fishing on biodiversity, particularly coastal marine biodiversity.[184] Diverse habitat is needed to support diverse species,[185] but fishing activities like trawling and dredging can cause habitat homogenisation (where habitats become more similar or uniform, see ‘Habitat’ section). Often impacts are not understood until a tipping point has already been reached from which the ecosystem cannot recover.
Diverse habitat is needed to support diverse species, but fishing activities like trawling and dredging can cause habitat homogenisation (where habitats become more similar or uniform).
There are examples of habitat losses in Tīkapa Moana the Hauraki Gulf, Te Tauihu-o-te-Waka Marlborough Sounds, Tikapa Moana-o-Hauraki Firth of Thames and Te Tai-o-Aorere Tasman Bay[105] – all are habitats that are thought to be associated with high biodiversity given their role as nursery ground for marine fishes.

Spatial distribution of organismal and habitat biodiversity in our 12-nautical mile territorial seas from [185].
The knowledge we do have around impacts on biodiversity has reportedly not been fully incorporated into our fisheries management, though it has important impacts on both environmental and fisheries outcomes.
The knowledge we do have around impacts on biodiversity has reportedly not been fully incorporated into our fisheries management, though it has important impacts on both environmental and fisheries outcomes.[184, 187]
Aotearoa New Zealand has over 15,000 known marine species and there are likely many marine species that have yet to be identified[1, 188]. Species can be identified using many different methods, from targeted studies, trawls, community science and more.[189, 190] A new species of fish discovered in Aotearoa New Zealand intertidal and shallow coastal water in 2018 (a type of clingfish) was identified by examination of museum specimens.
Many more species are waiting to be discovered. The New Zealand Government acknowledges that our current biodiversity system fails to tackle issues at the scale needed to address the ongoing and cumulative loss of Indigenous biodiversity.[191]
The New Zealand Government acknowledges that our current biodiversity system fails to tackle issues at the scale needed to address the ongoing and cumulative loss of Indigenous biodiversity.
While it is challenging to consider or protect species we don’t know about, even the species we know of are poorly understood. Maintaining biodiversity should be a priority for fisheries management in Aotearoa New Zealand to ensure ecosystems are resilient to stressors, including fishing.
Maintaining biodiversity should be a priority for fisheries management in Aotearoa New Zealand to ensure ecosystems are resilient to stressors, including fishing.
This discussion underpins recommendation in Themes 2, 3, 5, 6 and 7.
Food webs
A food web describes what eats what and aids understanding of how a change to an ecosystem will impact on different species. In the marine environment this is often determined as much by body size as it is by species. Generally speaking, the base of marine food webs are the phytoplankton and algae, while at the very top are high level predators like sharks, whales and dolphins. Juvenile top predators can also act as prey for smaller species. The position of a species in the food level is referred to as its trophic level (i.e. how far up the food chain the species are).
Defining marine food webs can be incredibly difficult and complex due to the sheer size of the ocean and the thousands of different interactions occurring.[192] The complexity of food webs means that diverse ecosystems can be supported, but it also means that removing even a single species can have significant impacts, such as trophic cascades (see case study: The Noises vs Cape Rodney-Okakari Point Marine Reserve). When we look to restoring areas, we need greater understanding of the ecosystem. For example, will reducing catch levels for rock lobster improve the situation (and at what level of reduction and on what timeframe can restoration be achieved)? Understanding food webs is important as trophic transfers often act as the foundation for ecosystem models, such as structural food web models (see section: ‘Models can support ecosystem approaches to fisheries management’).
Often marine trophic index, a measure of the mean trophic level of fish caught, is used as an ecosystem indicator. The measure can be derived from catch data alone.[193] Although few studies have analysed historical datasets on Aotearoa New Zealand’s catch and quota trades[105], a recent study used long-term datasets to analyse the shifting trophic structure of marine fisheries.[194] The study also made use of marine trophic index, which is available from Sea Around Us.


Defining marine food webs can be incredibly difficult and complex due to the sheer size of the ocean and the thousands of different interactions occurring.
The mean trophic level of catch in Aotearoa New Zealand has fluctuated over time as the nature of our fisheries changed.[194] For example, as inshore fisheries effort increased in the 50s this likely led to a reduction in the abundance of higher-level predators in the inshore fisheries and consequently to a lower mean trophic level. As fisheries expanded due to changes in vessel types, subsidies, and technologies, mean trophic level rose. For example, expansion into new offshore fishing areas can increase the marine trophic index (higher-level predators being caught) and mask fishing impacts in closer inshore fisheries. So while mean trophic levels can indicate changes in ecosystems and species abundance, its usefulness is constrained by the way it can be significantly impacted by economic, management, fishing technology and targeting patterns, as well as its reliance on the accuracy of the catch data it is based on.[195, 196] As marine trophic index does not measure the relative contributions of particular species, the depletion of one species could be masked by larger catch from other species. Nor does the index take into account the size distribution of the catch within species, so cannot consider the change in sizes of fish that can occur when there is overfishing of larger size classes.
Overall marine trophic index is a fairly rudimentary instrument for measuring ecosystem level effects. However, it does indicate cause for concern in Aotearoa New Zealand marine ecosystems. Further research into food webs and marine trophic index would benefit fisheries management by providing a greater understanding of the ecosystem impacts of targeting certain species.
Marine tropic index is a fairly rudimentary instrument for measuring ecosystem level effects. However, it does indicate cause for concern in Aotearoa New Zealand marine ecosystems.
Ecological monitoring
Globally there is a move to an EAFM and this requires conservation of ecosystem structure and function.[197, 198] This in turn means we have a greater need for long-term environmental and fisheries data. Ecosystem structure and function is complex and there is scientific disagreement over which indicator can best measure the overall state of an ecosystem. Understanding our data needs and agreeing on indicators is a prerequisite to long-term monitoring and reporting of environmental indicators. This will facilitate an enduring commitment to data collection and monitoring and requires a coordinated approach and priority setting with the ecosystem at the centre of decision making. Research that considers ecological significance, not only direct commercial significance, at both a national and local level is necessary. Our systems have opportunities to improve their targeting towards developing and maintaining long-term datasets.[199]
Ecosystem structure and function is complex and there is scientific disagreement over which indicator can best measure the overall state of an ecosystem. Understanding our data needs and agreeing on indicators is a prerequisite to long-term monitoring and reporting of environmental indicators.
Data needs for fisheries managers will vary from other sectors (both environmental and industry-related) but many indicators will have universal value. Ecological indicators for the Aotearoa New Zealand ocean have previously been discussed in many papers and reports, for example, [25, 87, 200, 201]. Marine trophic index was previously trialled in the Chatham Rise.[202–205] Research into indicators undertaken in Aotearoa New Zealand that could be built on includes:
Deepwater fisheries. A report in 2014 reviewed fisheries and environmental indicators as methods for monitoring and analysing environmental and ecosystem changes.[205] The report provides an assessment of the indicators that would be most useful in measuring the performance of deepwater fisheries within an environmental context. Usefulness is measured against factors such as relevance, credibility, and cost-effectiveness. The assessment also states whether data is currently available or whether new research or data would be needed for each indicator. Indicators are suggested in the following areas:
- Climate,
- Oceanographic,
- Primary productivity,
- Food web,
- Fisheries and fisheries management,
- The fish community,
- Benthic communities and habitats (seafloor integrity),
- Top predators, threatened and endangered species.
Coastal ecosystem monitoring. A NIWA report for the Department of Conservation lays out a strategy for a cost-effective monitoring programme for coastal marine habitats.[200]
National Marine Environment Monitoring Programme. Work was undertaken by the Ministry for Primary Industries in 2014 on developing a National Marine Environment Monitoring Programme for Aotearoa New Zealand.[206] The report identified important data gaps for monitoring such as water chemistry, water column biology, habitats, and nearshore and deep-sea biological communities. The Ministry for Primary Industries commissioned NIWA to build an online meta-database
Tier 1 national reporting statistics. The Ministry for Primary Industries has undertaken work on 1) ocean indicators for the Atmospheric and Ocean Climate Change Tier 1 Statistic [207] and 2) development of a Tier 1 statistic for Aotearoa New Zealand’s marine biodiversity.[177] Both pieces of work report on relevant indicators for ecological monitoring.
There has also been recent funding of over $13 million for a research programme focusing on Rangitāhua the Kermadec Islands, and their biodiversity and ecosystem.
The need for a monitoring programme is incredibly important and should align with Te Mana o te Taiao – Aotearoa New Zealand Biodiversity Strategy 2020 objectives. The objectives of the monitoring programme should be clearly defined for fisheries as well as wider outcomes. This may, for fisheries science, present a need to consider the weighting of direct commercial significance of research against ecological significance, at both a national and local level.
Without long-term data, there is no way to measure our performance against our sustainability objectives.[208] How this data integrates with our QMS focus on single-species stock management will be explored in later sections. Yet past attempts show that initiatives in this area struggle to progress from research to implementation.
This may, for fisheries science, present a need to consider the weighting of direct commercial significance of research against ecological significance, at both a national and local level. Without long-term data, there is no way to measure our performance against our sustainability objectives.
Lenfest Ocean Program
Moving EBFM from a concept to an operational approach presents challenges. Work by Lenfest Ocean Program and the Australian Commonwealth Scientific and Industrial Research Organization (CSIRO) has highlighted ways to address challenges in how to:
- Recognise when an ecosystem is (or is at serious risk of being) compromised.
- Implement EBFM in a way that suits different ecosystems and different fisheries (especially when they have different management systems).
- Identify which indicators can provide the most useful information for fisheries management systems.
The work, led by Dr Beth Fulton and Dr Keith Sainsbury, aims to develop practical indicators for ecosystem structure and function, as well as guidelines on how to apply these indicators in different ecosystems and management contexts.[209] The process this work will take includes:
- Developing potential ecosystem indicators. Identifying and consolidating potential indicators based on existing work, as well as potentially developing new indicators.
- Working with managers and policymakers. Identifying which indicators are most promising, could be readily applied in a fishery, and what challenges would need to be overcome to operationalise the indicators within existing fisheries management systems.
- Testing robustness of indicators and assessments. Testing the performance of the most promising indicators across different ecosystems and fisheries management systems.
- Applying indicators in case studies. Testing the utility and robustness of the indicators using data from case studies:
- Bering Sea, Alaska, US.
- Humboldt Current system, Chile.
- Marine waters off south-west India.
- Marine waters off south-east Australia.
There is significant potential to improve fisheries management through ecological indicators that can feed into ecosystem models (see section ‘Models can support ecosystem approaches to fisheries management’).
The Lenfest Ocean Program is a grant-making programme that funds scientific research on policy-relevant topics concerning the world’s oceans and communicates the results of the supported research to decision makers and other interested audiences.
This discussion underpins recommendations in Themes 4-7.
Data and knowledge gaps
The challenges that the marine environment faces are significant and complex. There are multiple stressors on marine ecosystems and while commercial fishing is only one of these, it is a significant stressor. The impacts of commercial fishing go beyond the target species of the fishing operation to the wider ecosystem – the habitats and other living organisms that make up the ecosystem, influencing ecosystem structure and function. As a result, fisheries management necessarily needs to look beyond single stocks to measure and monitor the impacts of fishing on the wider ecosystem to inform future management decisions. Despite the evidence clearly demonstrating these impacts, there remain significant gaps in the data and knowledge relating to how fishing impacts the marine environment and how resilient the system is to fishing practices, which currently limits the use of EAFM in Aotearoa New Zealand. A summary of the knowledge gaps and issues that currently limit our understanding are highlighted in the table below and covered further in ‘Commercial fisheries in 2020’.
A summary of the limitations and gaps in data and knowledge for the commercial fishing industry.
| Issue | Explanation and examples | Examples of current initiatives |
|---|---|---|
| Lack of knowledge about impact of related issues on fisheries | Climate change Growing understanding of climate change impacts on marine environment and fisheries but recognition that changes are inherently unpredictable.[1, 22] Plastics Knowledge gaps about the impacts of microplastics in the food chain and how plastic pollution impacts ecosystems. | Research in this area, see Impacts of Climate Change on New Zealand Fisheries and Aquaculture.[10] Sustainable Seas has a research programme looking at human activities and environmental change effects on ecosystems. MPI projects to quantify plastic in catches, microplastics from plankton surveys, and density of marine litter on seabed. |
| Interface between different sectors | Land-based impacts, including sedimentation Sedimentation impacts from forestry or farming impact coastal fisheries[22] and requires both passive and active restoration efforts but challenges arise from the lack of integration of fisheries management and land-based regulations. Cumulative effects Significant knowledge gaps about how the range of stressors act together and how these should be accounted for in fisheries management. | Recent publication by the PCE on estuaries has relevant recommendations. Recommendations from Sea Change – Tai Timu Tai Pari Hauraki Gulf Marine Spatial Plan for active restoration efforts. Sustainable Seas' development of the Aotearoa Cumulative Effects framework. |
| Lack of knowledge about fished/target species | Covered in section 'Commercial fishing has impacts on target species sustainability' | |
| Lack of knowledge about species and habitat | Data on fish stocks is important to manage a fishery, but so too is data that help us understand ecosystem health and the role of fisheries and other issues (cumulatively) driving environmental change. Exploration of our marine environment is still at an early stage.[151] We don’t have a very good handle on how our marine environment has changed or where its headed, or even what was there to begin with and what is there now in terms of species and habitats (15% of our seabed is swath-mapped and available in a publicly accessible format). Information on characteristics and extent of marine habitats is lacking,[1] including what the habitats of significance to fisheries are and where are they.[22] There are knowledge gaps in what species exist and where and it is likely many marine species have yet to be identified. | Fisheries Aquaculture and Innovation Plan. Current research in this area: EBM research, Sustainable Seas Relevant Seafood Innovation Limited projects underway: Knowledge Gaps – Literature Review and hoki/blue grenadier (Macruronus novaezelandiae) stock structure study. |
| Lack of knowledge about non-target species | Data and knowledge gaps relating to non-target species sustainability[22] and bycatch[113] and limited observer coverage, particularly for inshore fisheries. Limited data results in most ecological risk assessments being qualitative or semi-qualitative. Anecdotal or observational evidence of declines e.g. seabirds. Long-term datasets on bycatch species, outside of landings, could be improved for many species and locations. | A range of research on mammal, bird and shark bycatch. |
| Lack of knowledge about environmental impacts of fishing | There are data and knowledge gaps around the environmental impacts of fishing activities. Data can be hard to gather and interpret. For example, little known about impact of trawling and dredging on productivity on continental shelves and benthic habitats of significance[23] and resilience and recovery dynamics.[144] Disagreement on value of current approaches to assessing impacts.[166] Lacking agreed and defined ecological indicators. Other knowledge gaps relate to coastal marine biodiversity, coastal marine ecosystems, current environmental impacts, cumulative impacts of fishing on marine ecosystem, with little data on pre-QMS environmental impacts and limited information on current environmental impacts.[105] | Legal requirement to manage impacts (Fisheries Act 1996 8(2a)). Current research, e.g. dredging effect on marine mammals (Cawthron), but process, cumulative effects and ecosystems impacts more difficult to study. |
References and footnotes
[1] Ministry for the Environment and Stats NZ (2019) New Zealand’s Environmental Reporting Series: Our Marine Environment 2019.
[2] Ehrhart, C. et al. (2020) Climate-related risk scenarios for the 2050s: Exploring plausible futures for aquaculture and fisheries in New Zealand, The Aotearoa Circle.
[3] Bonar, S. (2021) More than 100 aquatic-science societies sound climate alarm, Nature, 589, p. 352.
[4] Lundquist, C. J. et al. (2011) Predicted impacts of climate change on New Zealand’s biodiversity, Pacific Conservation Biology, 17(3), pp. 179–191.
[5] Barange, M. et al. (2018) Impacts of climate change on fisheries and aquaculture: Synthesis of current knowledge, adaptation and mitigation options, FAO Fisheries and Aquaculture Technical Paper, 627.
[6] Davies, K. et al. (2018) Navigating collaborative networks and cumulative effects for sustainable seas, Environmental Science and Policy, 83, pp. 22–32.
[7] Law, C. S. et al. (2018) Ocean acidification in New Zealand waters: Trends and impacts, New Zealand Journal of Marine and Freshwater Research, 52(2), pp. 155–195.
[8] Brett, A. et al. (2020) Ocean data need a sea change to help navigate the warming world, Nature, 582(7811), pp. 181–183.
[9] Gadus microcephalus.
[10] Pinkerton, M. H. (2018) Impacts of climate change on New Zealand fisheries and aquaculture, in Climate Change Impacts on Fisheries and Aquaculture: A Global Analysis, pp. 91–119.
[11] Pseudophycis bachus.
[12] Jasus edwardsii.
[13] Beentjes, M. P. and Renwick, J. A. (2001) The relationship between red cod (Pseudophycis bachus), recruitment and environmental variables in New Zealand, Environmental Biology of Fishes, 61(3), pp. 315–328.
[14] Dunn, M. et al. (2009) Fish abundance and climate trends in New Zealand, New Zealand Aquatic Environment and Biodiversity Report No. 31.
[15] Parsons, D. M. et al. (2014) Snapper (Chrysophrys auratus): A review of life history and key vulnerabilities in New Zealand, New Zealand Journal of Marine and Freshwater Research, 48(2), pp. 256–283.
[16] Perna canaliculus.
[17] Handley, S. J. et al. (2020) Historic and contemporary anthropogenic effects on granulometry and species composition detected from sediment cores and death assemblages, Nelson Bays, Aotearoa-New Zealand, Continental Shelf Research, 202, p. 104147.
[18] Ministry for the Environment and Stats NZ (2020) Our Atmosphere and Climate 2020, New Zealand’s Environmental Reporting Series, p. 84.
[19] Durvillaea spp.
[20] Williams, J. et al. (2017) The economic contribution of commercial fishing to the New Zealand economy, Business and Economic Research limited (BERL), p. 55.
[21] Ministry for the Environment (2020) National climate change risk assessment for New Zealand, main report/Arotakenga Tūraru mō te Huringa Āhuarangi o Āotearoa Pūrongo Whakatōpū, Wellington: Ministry for the Environment.
[22] Peart, R. (2018) Voices from the Sea: Managing New Zealand’s fisheries, Environmental Defence Society.
[23] Jarvis, R. M. and Young, T. (2019) Key research priorities for the future of marine science in New Zealand, Marine Policy, 106, p.103539.
[24] Ministry for the Environment and Stats NZ (2019) New Zealand’s Environmental Reporting Series: Environment Aotearoa 2019.
[25] Pinkerton, M.H. (2010) Headline indicators for the New Zealand Ocean, NIWA, Wellington, New Zealand.
[26] Doney, S. C. et al. (2020) The impacts of ocean acidification on marine ecosystems and reliant human communities, Annual Review of Environment and Resources, 45, pp. 83–112.
[27] Fulton, E. A. et al. (2018) Decadal scale projection of changes in Australian fisheries stocks under climate change, CSIRO Report to FRDC.
[28] Adaptation of Commonwealth fisheries management to climate change
[29] Willis, T. et al. (2007) Climate change and the New Zealand marine environment, NIWA Client Report NEL2007-025, p. 88.
[30] Royal Society of New Zealand (2016) Climate change implications for New Zealand, pp. 1–71.
[31] Lake, R. et al. (2017) Adapting to climate change: Information for New Zealand food safety systems, pp. 1–135. A project for the Ministry for Primary Industries sustainable land management and climate change fund.
[32] IPCC (2019) Special report on the ocean and cryosphere in a changing climate. Intergovernmental Panel on Climate Change.
[33] Morrison, M. A. et al. (2014) Linking marine fisheries species to biogenic habitats in New Zealand: A review and synthesis of knowledge, New Zealand Aquatic Environment and Biodiversity Report No. 130, p. 156.
[34] Pleuronectidae species.
[35] MacDiarmid, A. et al. (2012) Assessment of anthropogenic threats to New Zealand marine habitats, New Zealand Aquatic Environment and Biodiversity Report No. 93.
[36] Thrush, S. F. et al. (2004) Muddy waters: Elevating sediment input to coastal and estuarine habitats, Frontiers in Ecology and the Environment, 2(6), pp. 299–306.
[37] Basher, L. R. (2013) Erosion processes and their control in New Zealand, In: Ecosystem services in New Zealand: Conditions and Trends, Manaaki Whenua Press, pp. 363–374.
[38] NIWA (2018) Reducing sedimentation, Water & Atmosphere.
[39] Environment Foundation (2018) Addressing sedimentation and pollution, Environment Guide.
[40] Cardiidae species.
[41] Paphies australis.
[42] Morrison, M. A. et al. (2009) A review of land-based effects on coastal fisheries and supporting biodiversity in New Zealand, New Zealand aquatic environment and biodiversity Report No. 37, p. 100.
[43] Greiner, J. T. et al. (2013) Seagrass restoration enhances “Blue Carbon” sequestration in coastal waters, PLoS One, 8(8), pp. 1–8.
[44] Udy, J. A. et al. (2019) Regional differences in kelp forest interaction chains are influenced by both diffuse and localized stressors, Ecosphere, 10(10).
[45] Parapercis colias.
[46] Clark, D. and Crossett, D. (2019) Subtidal seagrass surveys at Slipper and Great Mercury Islands, Waikato Regional Council Technical Report 2019/29, Hamilton, New Zealand.
[47] Paphies subtriangulata.
[48] Cumming, H. and Herbert, N. A. (2016) Gill structural change in response to turbidity has no effect on the oxygen uptake of a juvenile sparid fish, Conservation Physiology, 4(1).
[49] Peart, R. (2017) A “sea change” in marine planning: the development of New Zealand’s first marine spatial plan, Policy Quarterly, 13(2), pp. 3–9.
[50] NIWA (2017) Protecting and restoring seagrass – what have we achieved and where to next?, Freshwater and estuaries update.
[51] Auckland Council (2013) Section 32 Report on the proposed Auckland unitary plan: Appendix 3.11.7 – 4.4. State of the environment and biodiversity – Marine.
[52] Abrahim, G. and Parker, R. (2002) Heavy-metal contaminants in Tamaki Estuary: Impact of city development and growth, Auckland, New Zealand, Environmental Geology, 42(8), pp. 883–890.
[53] Moreau, M. et al. (2019) A baseline assessment of emerging organic contaminants in New Zealand groundwater, Science of the Total Environment, 686, pp. 425–439.
[54] Molnar, J. L. et al. (2008) Assessing the global threat of invasive species to marine biodiversity, Frontiers in Ecology and the Environment, 6(9), pp. 485–492.
[55] Walsh, J. R. et al. (2016) Invasive species triggers a massive loss of ecosystem services through a trophic cascade, Proceedings of the National Academy of Sciences of the United States of America, 113(15), pp. 4081–4085.
[56] Diana, J. S. (2009) Aquaculture production and biodiversity conservation, BioScience, 59(1), pp. 27–38.
[57] Seebens, H. et al. (2013) The risk of marine bioinvasion caused by global shipping, Ecology Letters, 16(6), pp. 782–790.
[58] Cunningham, S. et al. (2019) Mitigating the threat of invasive marine species to fiordland: New Zealand’s first pathway management plan, Management of Biological Invasions, 10(4), pp. 690–708.
[59] Rech, S. et al. (2016) Marine litter as a vector for non-native species: What we need to know, Marine Pollution Bulletin, 113(1–2), pp. 40–43.
[60] Gregory, M. R. (2009) Environmental implications of plastic debris in marine settings- entanglement, ingestion, smothering, hangers-on, hitch-hiking and alien invasions, Philosophical Transactions of the Royal Society B: Biological Sciences, 364(1526), pp. 2013–2025.
[61] Toxoplasma gondii.
[62] Cephalorhynchus hectori hectori and Cephalorhynchus hectori maui. The taxonomic status of Hector’s and Māui dolphins is debated.
[63] Department of Conservation (2019) Addressing the threat of toxoplasmosis to Hectors and Māui dolphins: An action plan, pp. 1–10.
[64] Ostrea chilensis.
[65] Culloty, S. C. and Mulcahy, M. F. (2007) Bonamia ostreae in the native oyster Ostreae edulis: A review, Marine Environment and Health Series No. 29, Marine Institute 2007.
[66] Lane, H. S. et al. (2016) Bonamia ostreae in the New Zealand oyster (Ostrea chilensis): A new host and geographic record for this haplosporidian parasite, Diseases of Aquatic Organisms, 118(1), pp. 55–63.
[67] Li, W. C. et al. (2016) Plastic waste in the marine environment: A review of sources, occurrence and effects, Science of the Total Environment, 566–567, pp. 333–349.
[68] WWF (2015) Living Blue Planet Report: Species, habitats and human well-being.
[69] UNEP (2016) Marine Litter Vital Graphics.
[70] Royal Society Te Apārangi (2019) Plastics in the Environment: Te Ao Hurihuri – The Changing World.
[71] Markic, A. et al. (2018) Double trouble in the South Pacific subtropical gyre: Increased plastic ingestion by fish in the oceanic accumulation zone, Marine Pollution Bulletin, 136, pp. 547–564.
[72] Webb, S. et al. (2019) Microplastics in the New Zealand green lipped mussel Perna canaliculus, Marine Pollution Bulletin, 149.
[73] Campbell, M. L. et al. (2017) Aquaculture and urban marine structures facilitate native and non-indigenous species transfer through generation and accumulation of marine debris, Marine Pollution Bulletin, pp. 304–312.
[74] De-la-Torre, G. E. (2020) Microplastics: An emerging threat to food security and human health, Journal of Food Science and Technology, 57(5), pp. 1601–1608.
[75] Macfadyen, G. et al. (2009) Abandoned, lost or otherwise discarded fishing gear, FAO Fisheries and Aquaculture Technical Paper 523, p. 115.
[76] Hodgson, E. E. et al. (2019) Moving beyond silos in cumulative effects assessment, Frontiers in Ecology and Evolution, 7, pp. 1–8.
[77] Thrush, S. F. et al. (2020) Cumulative stressors reduce the self-regulating capacity of coastal ecosystems, Ecological Applications, 31(1), pp. 1–12.
[78] Gadus morhua.
[79] Myers, R. A. et al. (1997) Why do fish stocks collapse? The example of cod in Atlantic Canada, Ecological Applications, 7(1), pp. 91–106.
[80] Lowe, P. K. et al. (2011) Empirical models of transitions between coral reef states: Effects of regions, marine protected areas, and environmental change scenarios, Support information S1: Effects of changing state definitions, PLoS One, 6(11), p. e26339.
[81] New Zealand scallop, Pecten novaezelandiae.
[82] Clapcott, J. et al. (2018) Mātauranga Māori: Shaping marine and freshwater futures, New Zealand Journal of Marine and Freshwater Research, 52(4), pp. 457–466.
[83] Davies, K. et al. (2020) Trans-Tasman cumulative effects management: A comparative study, Frontiers in Marine Science, 7, pp. 1–19.
[84] Davies, K. (2019) Navigating the implementation impasse: Enabling interagency collaboration on cumulative effects, National Science Challenge: Sustainable Seas. p. 8.
[85] Davies, K. et al. (2018) The evolution of marine protected area planning in Aotearoa New Zealand: Reflections on participation and process, Marine Policy, 93, pp. 113–127.
[86] Fisheries New Zealand statement on how they manage to ensure fishing is sustainable
[87] Ministry for the Environment and Stats NZ (2016) Our Marine Environment 2016.
[88] Roux, M. et al. (2015) A sustainability assessment framework for fish by-catch in New Zealand deepwater fisheries, ICES Annual Science Conference, pp. 2.
[89] Griggs, L. H. et al. (2018) Fish bycatch in New Zealand tuna longline fisheries, 2010-11 and 2014-15, New Zealand Fisheries Assessment Report 2018/29.
[90] Ministry for Primary Industries (2020) Aquatic environment and biodiversity annual review 2019-20, p. 724.
[91] Larus dominicanus dominicanus.
[92] Anderson, O. F. et al. (2019) Non-target fish and invertebrate catch and discards in New Zealand hoki, hake, ling, silver warehou, and white warehou trawl fisheries from 1990-91 to 2016-17. New Zealand Aquatic Environment and Biodiversity Report No. 220.
[93] Bremner, G. et al. (2009) Unreported bycatch in the New Zealand West Coast South Island hoki fishery, Marine Policy, 33(3), pp. 504–512.
[94] Simmons, G. et al. (2016) Reconstruction of marine fisheries catches for New Zealand (1950-2010). Institute for the Oceans and Fisheries, Working paper series, Working paper 2015-87.
[95] Hoyle, S. D. et al. (2017) Development of Southern Hemisphere porbeagle shark stock abundance indicators using Japanese commercial and survey data, New Zealand Fisheries Assessment Report 2017/07.
[96] McCormack, F. (2017) Sustainability in New Zealand’s quota management system: A convenient story, Marine Policy, 80, pp. 35–46.
[97] Winder, G. M. (2018) Context and challenges: The limited “success” of the Aotearoa/New Zealand fisheries experiment, 1986–2016, Fisheries, Quota Management and Quota Transfer, p. 77-98.
[98] Abraham, E. R. and Berkenbusch, K. (2019) Preparation of data for protected species capture estimation, updated to 2016 – 17. New Zealand Aquatic Environment and Biodiversity Report No. 233.
[99] Thompson, F. N. et al. (2017) Preparation of data on observed protected species captures, 2002 – 03 to 2014 – 15), New Zealand Aquatic Environment and Biodiversity Report 192.
[100] Ford, R. B. et al. (2018) Qualitative (Level 1) Risk Assessment of the impact of commercial fishing on New Zealand chondrichthyans: An update for 2017. New Zealand Aquatic Environment and Biodiversity Report No. 201.
[101] Roberts, J. O. et al. (2019) Spatial risk assessment of threats to Hector’s and Māui dolphins (Cephalorhynchus hectori), New Zealand Aquatic Environment and Biodiversity Report No. 214.
[102] Richard, Y. et al. (2020) Assessment of the risk of commercial fisheries to New Zealand seabirds, 2006–07 to 2016-2017, New Zealand Aquatic Environment and Biodiversity Report No. 237.
[103] Abraham, E. R. et al. (2017) Assessment of the risk to New Zealand marine mammals from commercial fisheries, New Zealand Aquatic Environment and Biodiversity Report No. 189.
[104] The Sustainable Future Institute (2011) Evaluating the fisheries and aquaculture dataset, Sustainable future institute Working Paper 2011/6.
[105] The Nature Conservancy (2017) Learning from New Zealand’s 30 years of experience managing fisheries under a Quota Management System.
[106] Fisheries New Zealand (2018) Aquatic environment and biodiversity annual review 2018: A summary of environmental interactions between the seafood sector and the aquatic environment.
[107] Ministry for Primary Industries (2020) Aquatic environment and biodiversity annual review 2019-20, p. 724.
[108] Taylor, G. A. (2000) Action plan for seabird conservation in New Zealand, Part A: Threatened seabirds, Threatened Species Occasional Publication No. 16, p. 234, Department of conservation, Wellington.
[109] Robertson, H. A. et al. (2017) Conservation status of New Zealand birds, 2016, New Zealand Threat Classification Series 19, p. 23, Department of Conservation, Wellington.
[110] Large, K. et al. (2019) Spatial assessment of fisheries risk for New Zealand sea lions at the Auckland Islands, New Zealand Aquatic Environment and Biodiversity Report No. 224, p. 85.
[111] Brownell Jr, R. L. et al. (2019) Bycatch in gillnet fisheries threatens critically endangered small cetaceans and other aquatic megafauna, Endangered Species Research, 40, pp. 285–296.
[112] Díaz-Guisado, D. (2014) Effects of marine reserve protection on adjacent non-protected populations in New Zealand. A thesis submitted for the degree of Doctor of Philosophy in Marine Biology at the Victoria University, Wellington, New Zealand.
[113] Hare, K. M. et al. (2019) Intractable: Species in New Zealand that continue to decline despite conservation efforts, Journal of the Royal Society of New Zealand, 49(3), pp. 301–319.
[114] Tracey, D. et al. (2020) INT2019-05: Coral biodiversity in deep-water fisheries bycatch, Prepared for the Conservation Services Programme, Department of Conservation, NIWA Client Report No. 2020223WN.
[115] Francis, M. (2017) Bycatch of white sharks in commercial set nets, NIWA Client Report No. 2017113WN, p. 27.
[116] Francis, M. (2017) Review of commercial fishery interactions and population information for New Zealand basking shark, NIWA Client Report No 2017083WN.
[117] Queiroz, N. et al. (2019) Global spatial risk assessment of sharks under the footprint of fisheries, Nature, 572(7770), pp. 461–466.
[118] Finucci, B. et al. (2019) The extinction risk of New Zealand chondrichthyans, Aquatic Conservation: Marine and Freshwater Ecosystems, 29(5), pp. 783–797.
[119] Pinte, N. et al. (2020) Ecological features and swimming capabilities of deep-sea sharks from New Zealand, Deep-Sea Research Part I: Oceanographic Research Papers, 156.
[120] MacNeil, M. A. et al. (2020) Global status and conservation potential of reef sharks, Nature, pp. 801-806.
[121] Mustelus lenticulatus.
[122] Input from Fisheries New Zealand.
[123] Carcharodon carcharias.
[124] Hillary, R. M. et al. (2018) Genetic relatedness reveals total population size of white sharks in eastern Australia and New Zealand, Scientific Reports, 8(1), pp. 1–9.
[125] Fisheries New Zealand and Department of Conservation (2019) National Plan of Action: Seabirds 2020: Reducing the incidental catch of seabirds in fisheries. Draft for Consultation, pp. 1–24.
[126] Fisheries New Zealand and Department of Conservation (2020) National plan of action: Seabirds: Reducing the incidental catch of seabirds in fisheries.
[127] Procellaria parkinsoni.
[128] Thalassarche salvini.
[129] Procellaria westlandica.
[130] Puffinus carneipes.
[131] Thalassarche bulleri.
[132] Diomedea antipodensis.
[133] Debski, I. et al. (2016) Observer coverage to monitor seabird captures in pelagic longline fisheries, WCPFC-SC12-2016/ EB-IP-07, in 12th regular session of the Western and Central Pacific Fisheries Commission Scientific Committee, Bali, Indonesia.
[134] Ramm, K. (2012) Conservation Services Programme observer report: 01 July 2009 to 30 June 2010, Department of Conservation Marine Conservation Services Series 1.
[135] See reporting by Forest and Bird and WWF.
[136] Baker, C. S. et al. (2019) Conservation status of New Zealand marine mammals, 2019, Department of Conservation.
[137] Roberts, J. O. and Doonan, I. J. (2016) Quantitative risk assessment of threats to New Zealand sea lions, New Zealand Aquatic Environment and Biodiversity Report No. 166.
[138] Department of Conservation and Fisheries New Zealand (2019) Protecting Hector’s and Māui dolphins: Consultation on proposals for an updated Threat Management Plan.
[139] Ministry for Primary Industries and Department of Conservation (2017) New Zealand sea lion/rāpoka Threat Management Plan, p. 17.
[140] Department of Conservation (2019) New Zealand’s sixth national report to the United Nations Convention on biological diversity, Reporting period: 2014-2018.
[141] Information from Fisheries New Zealand. This includes ‘bottom trawl’, ‘precision bottom trawl’ and ‘bottom pair trawl’ categories.
[142] Tracey, D. and Hjorvarsdottir, F. (2019) The state of knowledge of deep-sea corals in the New Zealand region, NIWA Science and Technology Series Number 84, p. 140.
[143] Baco, A. R. et al. (2019) Amid fields of rubble, scars, and lost gear, signs of recovery observed on seamounts on 30- to 40-year time scales, Science Advances, 5(8), pp. 1–8.
[144] Clark, M. R. et al. (2019) Little evidence of benthic community resilience to bottom trawling on seamounts after 15 Years, Frontiers in Marine Science, 6(63), pp. 1–16.
[145] Hughes, K. M. et al. (2014) Investigating the effects of mobile bottom fishing on benthic biota: A systematic review protocol, Environmental Evidence, 3(23), pp. 9.
[146] Eayrs, S. et al. (2020) Mitigation techniques to reduce benthic impacts of trawling: MIT2019-02 A review for the Department of Conservation by Terra Moana Limited, pp. 1–59. Terra Moana.
[147] Southern Scallop Working Group and Fisheries New Zealand (2020) Southern Scallop Strategy Marlborough Sounds.
[148] Ministry of Fisheries (2009) Appendix 2 Foveaux Strait Dredge Oyster Information Brief, p. 29.
[149] Williams, J. R. et al. (2014) Review of the Southern scallop fishery (SCA 7), New Zealand Fisheries Assessment Report 2014/07.
[150] Shotton, R. et al. (2008) New Zealand’s challenger scallop enhancement company: From reseeding to self-governance, in Case studies in fisheries self-governance, Food and Agriculture Organization of the United Nations.
[151] MacDiarmid, A. B. et al. (2013) New Zealand marine ecosystem services, Ecosystem services in New Zealand-Conditions and trends, p. 539.
[152] MacDiarmid, A. B. et al. (2013) Sensitive marine benthic habitats defined, Prepared for Ministry for the Environment, NIWA Client Report, p. 72.
[153] Jackson, S. E. and Lundquist, C. J. (2016) Limitations of biophysical habitats as biodiversity surrogates in the Hauraki Gulf Marine Park, Pacific Conservation Biology, 22(2), pp. 159–172.
[154] Land Information New Zealand (2014) Annual report 2013-2014.
[155] Helson, J. et al. (2010) Private rights, public benefits: Industry-driven seabed protection, Marine Policy, 34(3), pp. 557–566.
[156] Geange, S. W. et al. (2017) Integrating conservation and economic objectives in MPA network planning: A case study from New Zealand, Biological Conservation, 210, pp. 136–144.
[157] Rieser, A. et al. (2013) Trawl fisheries, catch shares and the protection of benthic marine ecosystems: Has ownership generated incentives for seafloor stewardship?, Marine Policy, pp. 75–83.
[158] Mossop, J. (2020) Marine Protected Areas and Area-Based Management in New Zealand, Asia Pacific Journal of Ocean Law and Policy (5), pp. 169–185.
[159] Eddy, T. D. (2013) On the need for meaningful Marine Protected Area (MPA) standards, Aquatic Conservation: Marine and Freshwater Ecosystems, 23(4), pp. 481–482.
[160] Baird, S.J. and Mules, R. (2021, in review) Extent of bottom contact by commercial trawling and dredging in New Zealand waters, 1990–2019, New Zealand Aquatic Environment and Biodiversity Report, pending.
[161] For example, resolution of reporting can mean that new transects may be artificially aggregated and must be accounted for in analysis. Input from FNZ.
[162] Black, J. and Tilney, R. (2017) Monitoring New Zealand’s trawl footprint for deep water fisheries: 1989-90 to 2011-2012 and 2012-2013, New Zealand Aquatic Environment and Biodiversity Report No. 176.
[163] For example, number of contacted cells, aggregate area, and footprint are affected. The effect of this is greater for inshore fish stocks than for deepwater data. Input from FNZ.
[164] Hiddink, J. G. et al. (2020) Selection of indicators for assessing and managing the impacts of bottom trawling on seabed habitats, Journal of Applied Ecology, 57(7), pp. 1–11.
[165] The current approach uses the overlap of trawl footprint with Marine Environment Classification, Benthic Optimised MEC, and depth classes.
[166] Ford, R. B. et al. (2016) Assessing the effects of mobile bottom fishing methods on benthic fauna and habitats: Report from a workshop in 2019, New Zealand Fisheries Science review 2016/2.
[167] Anderson, T. J. et al. (2019) Review of New Zealand’s key biogenic habitats, NIWA Client Report No. 2018139WN, p. 190.
[168] Morrison, M. A. et al. (2014b) Habitats and areas of particular significance for coastal finfish fisheries management in New Zealand: A review of concepts and current knowledge, and suggestions for future research, New Zealand Aquatic Environment and Biodiversity Report No. 125.
[169] Department of Conservation and Ministry of Fisheries (2011) Coastal marine habitats and marine protected areas in the New Zealand Territorial Sea: A broad scale gap analysis, Volume 1.
[170] Waikato Regional Council (2020) Habitat mapping for the Waikato region coastal marine area: Bathymetry and substrate type.
[171] Leathwick, J. R. et al. (2012) A Benthic-optimised Marine Environment Classification (BOMEC) for New Zealand waters, New Zealand Aquatic Environment and Biodiversity Report No. 88 2012p. 54.
[172] Leathwick, J. et al. (2006) Development of a marine environmental classification optimised for demersal fish, Department of Conservation, NIWA Client Report.
[173] Stephenson, F. et al. (2018) Using Gradient Forests to summarize patterns in species turnover across large spatial scales and inform conservation planning, Diversity and Distributions, 24(11), pp. 1641–1656.
[174] Stephenson, F. et al. (2020) A New Zealand demersal fish classification using Gradient Forest models, New Zealand Journal of Marine and Freshwater Research, 54(1), pp. 60–85.
[175] Bowden, D. et al. (2011) Evaluation of the New Zealand marine environment classifications using ocean survey 20/20 data from Chatham Rise and Challenger Plateau, New Zealand Aquatic Environment and Biodiversity Report No. 77.
[176] Neil, H. L. et al. (2018) What lies beneath? Guide to Survey Results and Graphical Portfolio Part One, pp. 11–137.
[177] Lundquist, C. J. et al. (2015) Development of a Tier 1 National reporting statistic for New Zealand’s marine biodiversity, New Zealand Aquatic Environment and Biodiversity Report No.147.
[178] Barbier, E. B. (2017) Marine ecosystem services, Current Biology, 27(11), pp. R507–R510.
[179] Grassle, F. J. (2013) Marine Ecosystems, Encyclopedia of Biodiversity, Second Edition, 5, pp. 45–55.
[180] Hughes, T. P. et al. (2005) New paradigms for supporting the resilience of marine ecosystems, Trends in Ecology and Evolution, 20(7), pp. 380–386.
[181] Isbell, F. et al. (2015) Biodiversity increases the resistance of ecosystem productivity to climate extremes, Nature, 526(7574), pp. 574–577.
[182] Rastelli, E. et al. (2020) A high biodiversity mitigates the impact of ocean acidification on hard-bottom ecosystems, Scientific Reports, 10(1), pp. 1–13.
[183] Attenborough, D. (2020) A Life on Our Planet: My Witness Statement and a Vision for the Future, Ebury Press.
[184] Thrush, S. et al. (2016) Implications of fisheries impacts to seabed biodiversity and ecosystem-based management, ICES Journal of Marine Science, 73(1), pp. 44–50.
[185] Thrush, S. F. et al. (2006) Predicting the effects of habitat homogenization on marine biodiversity, Ecological Applications, 16(5), pp. 1636–1642.
[186] Gordon, D. P. et al. (2010) Marine biodiversity of Aotearoa New Zealand, PLoS One, 5(8), pp. 17.
[187] Biodiversity mapping from [185] and Beaumont, J. et al. (2008) Mapping the values of New Zealand’s coastal waters. 1. Environmental values, Biosecurity New Zealand Technical Paper No. 2008/16.
[188] Costello, M. J. et al. (2012) Predicting total global species richness using rates of species description and estimates of taxonomic effort, Systematic Biology, 61(5), pp. 871–883.
[189] Gordon, D. P. and Ballantine, B. (2013) Contribution of the Leigh Marine Laboratory to knowledge of marine species diversity, New Zealand Journal of Marine and Freshwater Research, 47(3), pp. 277–293.
[190] Liggins, L. et al. (2020) Natural history footage provides new reef fish biodiversity information for a pristine but rarely visited archipelago, Scientific Reports, 10(1), p. 3159.
[191] New Zealand Government (2019c) Te Koiroa O Te Koiora: Our shared vision for living with nature, A discussion document on proposals for a biodiversity strategy for Aotearoa New Zealand, p. 68.
[192] Albouy, C. et al. (2019) The marine fish food web is globally connected, Nature Ecology and Evolution, 3(8), pp. 1153–1161.
[193] Pauly, D. and Zeller, D. (2018) The making of a global marine fisheries catch database for policy development, in World Seas: An Environmental Evaluation Volume III: Ecological Issues and Environmental Impacts, Elsevier.
[194] Durante, L. M. et al. (2020) Shifting trophic architecture of marine fisheries in New Zealand: Implications for guiding effective ecosystem-based management, Fish and Fisheries, pp. 1–18.
[195] Pauly, D. et al. (2005) Background and interpretation of the “Marine Trophic Index” as a measure of biodiversity, Philosophical Transactions: Biological Sciences, 360(1454), pp. 415–423.
[196] Branch, T. A. et al. (2010) The trophic fingerprint of marine fisheries, Nature, 468(7322), pp. 431–435.
[197] Schmeller, D. S. et al. (2017) Case studies of capacity building for biodiversity monitoring, The GEO Handbook on Biodiversity Observation Networks, Springer, pp. 309-326.
[198] Townsend, H. et al. (2019) Progress on implementing ecosystem-based fisheries management in the United States through the use of ecosystem models and analysis, Frontiers in Marine Science, 6, pp. 1–17.
[199] Parliamentary Commissioner for the Environment (2019) Focusing Aotearoa New Zealand’s environmental reporting system, p. 100.
[200] Thrush, S. et al. (2011) A strategy to assess trends in the ecological integrity of New Zealand’s marine ecosystems, NIWA Client Report No. HAM2011-140, p. 58.
[201] Coll, M. et al. (2016) Ecological indicators to capture the effects of fishing on biodiversity and conservation status of marine ecosystems, Ecological Indicators, 60, pp. 947–962.
[202] Pinkerton, M. H. (2011) A balanced trophic model of the Chatham Rise, New Zealand. NIWA. Wellington, New Zealand.
[203] Pinkerton, M. H. et al. (2015) Marine Trophic Index based on research trawl surveys of the Chatham Rise, 1992–2014, NIWA Client Report No. WLG2015-8, prepared for Ministry for the Environment, p. 26.
[204] Pinkerton, M. et al. (2017) Ocean ecosystem indicators for New Zealand: Review of the Marine Trophic Index, NIWA, Wellington.
[205] Tuck, I. D. et al. (2014) Ecosystem and Environmental Indicators for Deepwater Fisheries, New Zealand Aquatic Environment and Biodiversity Report No. 127.
[206] Hewitt, J. E. (2014) Development of a national marine environment monitoring programme (MEMP) for New Zealand, New Zealand Aquatic Environment and Biodiversity Report No.141, (141), p. 126.
[207] Pinkerton, M. H. et al. (2015) Reporting on the state of the New Zealand marine environment: Recommendations for ocean indicators as part of the atmospheric and ocean climate change Tier 1 statistic, New Zealand Aquatic Environment and Biodiversity Report No. 151.
[208] Vale M, H. S. (2013) Sustained observation of marine biodiversity and ecosystems, Oceanography: Open Access, pp. 1–4.
[209] Fulton, B. (2018) Benchmarks for ecosystem assessment: Indicators for practical ecosystem-based fisheries management.