
Commercial fisheries in 2020
This section provides context on how our fisheries are regulated and managed, and looks at the state of our fisheries in 2020. It includes a summary of how we’re monitoring and reporting on our performance, how we are currently performing, the research that we’re currently undertaking, and the limitations of our current data and knowledge. It provides an overview only and does not set out to provide a comprehensive description. This provides further context for the research and innovation aimed to improve the sustainability of our commercial fisheries covered in later sections. The information is focused on how science can support changes, acknowledging that science alone is not a solution to all of the issues in the marine domain, and that the science is often contested. A recurring theme is the challenge of managing a complex biological system at multiple scales within our current complex regulatory system.
The information is focused on how science can support changes, acknowledging that science alone is not a solution to all of the issues in the marine domain, and that the science is often contested.
The section is split into the following areas of focus:

Fisheries management involves the use of many different tools
This covers key parts of our fisheries management system, including: setting catch limits and allocating catch allowance; fisheries plans; targeted management of stocks; national plans of actions; and threat management plans.

Commercial fishing has impacts on target species sustainability
Commercial fishing targets many different stocks each year in the inshore and deepwater fisheries. Information is provided on the direct impacts of fishing activities to commercial fish species and how Aotearoa New Zealand is performing, to complement the earlier discussion of the impacts to the wider ecosystem.

Research and regulatory initiatives are underway but poorly integrated
There are many regulatory, industry and other initiatives underway in our fisheries sector. Fisheries-related research programmes are described and discussion provided on how fisheries research is funded.
Contents
- Fisheries management involves the use of many different tools
- Commercial fishing has impacts on target species sustainability
- Research and regulatory initiatives are underway but poorly integrated
- Regulator initiatives and data transformation
- Industry initiatives
- Iwi initiatives
- Research programmes, funding and prioritisation
- We need a plan for our oceans
- References and footnotes
Fisheries management involves the use of many different tools
Having illustrated the complexities of the regulatory system for the marine environment, we now narrow our focus to the specifics of managing commercial fisheries themselves. Fisheries New Zealand is the key regulator tasked with guiding the sustainable use of fisheries resources to the greatest overall benefit to New Zealanders. They do so under the Fisheries Act 1996. This focus includes the sustainability of Aotearoa New Zealand’s wild fish stocks, marine biodiversity, and the wider aquatic environment. This report focuses solely on commercial fishing of wild fish stocks, with aquaculture, customary and recreational fishing outside of scope (see Terms of Reference).
A central and significant part of fisheries management is the QMS, but this is only one element of the overall approach that Aotearoa New Zealand takes to managing fisheries. The key parts of this system are outlined in this section, including:
The connection between the numerous documents in terms of an overarching strategy or coherent governance structure is poorly understood. This makes it difficult to identify gaps in management and opportunities for reducing management overlap, and doesn’t support a high level of public confidence in management of our fisheries and ocean ecosystem, an environment where data and its interpretation are highly contentious.
- Environmental principles: These are present within the Fisheries Act 1996 and could be more widely implemented (see also appendix 1 and [1]).
- Setting catch limits and allocating catch allowance: The QMS allocates shares in each fish stock as quota. Quota generates an entitlement to catch a proportion of the TACC each year (ACE) within the relevant QMA. The Minister for Oceans and Fisheries sets the TAC, guided by the Harvest Strategy Standard.
- Integrated fisheries plans: Fisheries New Zealand produces integrated fisheries plans focusing on each of three fisheries: inshore finfish fisheries (under development); deepwater and middle-depth fisheries; and highly migratory species fisheries. Implementation of these plans is through Annual Operation Plans and Annual Review Reports (the management actions that will be implemented each year and assessment of the performance against objectives). Not all plans have been finalised or operationalised consistently.
- Targeted management of fisheries through action plans or strategies: Fisheries New Zealand works in collaboration with others to develop management plans to provide targeted support to fisheries that are not meeting sustainability expectations and need closer management or to outline management frameworks for protected species impacted by fisheries.
- Managing impacts on marine species through management plans: Fisheries New Zealand works in collaboration with others to develop management plans or strategies to provide targeted support to provide protection for species impacted by fishing.
Each of these aspects of fisheries management are described in further detail in this section, including commentary on where information is contested.
There are ongoing tensions between the management of fisheries and supporting ecosystem resilience. The connection between the numerous documents in terms of an overarching strategy or coherent governance structure is poorly understood. This makes it difficult to identify gaps in management and opportunities for reducing management overlap, and doesn’t support a high level of public confidence in management of our fisheries and ocean ecosystem, an environment where data and its interpretation are highly contentious.
Environmental principles
The Fisheries Act 1996 requires that people undertaking fishing activities or making decisions covered by the Act “take into account” three environmental principles. These are:
- Associated or dependent species should be maintained above a level that ensures their long-term viability.
- Biological diversity of the aquatic environment should be maintained.
- Habitats of particular significance for fisheries management should be protected.
These principles are consistent with an EAFM, drawn from UNCLOS and the UN CBD. While in the RMA decision makers must “recognise and provide for” matters of national importance,[2] the Fisheries Act 1996 is not as rigorous. In 1996 on their commentary on the then Fisheries Bill, the Primary Production Committee wrote that the “recognise and provide for” phrasing would place “too strong an obligation on persons exercising functions under the Act”, opting instead for the more discretionary phrasing “take into account”.[3]
As discussed earlier, Fisheries New Zealand has the dual duty of ensuring sustainability and providing for utilisation in the context of these principles. While Fisheries New Zealand does not explicitly mention these principles on their website, the Ministry for Primary Industries states that they “want to ensure our seas are healthy and there are enough fish for future generations” alongside information on MPAs, other measures to protect marine life, and how fish are counted. The extent to which these principles are “taken into account” is contested. For example, HPSFM have not been used to protect habitats (as discussed in ‘Managing impacts through protection tools’). Fishing impacts on associated or dependent species (as well as the wider ecosystem and biodiversity) are discussed in the section ‘Challenges for the marine environment’.
Setting catch limits and allocating catch allowance
The QMS was introduced in Aotearoa New Zealand in 1986. Under the QMS, fish stocks are generally divided into species and geographic area. The system is used to limit the amount of commercial catch and allocate commercial harvest rights. It has a primary focus on single stocks. The adequacy of this approach has been challenged (see for example, [4, 5]), however the QMS itself is outside the scope of our report.
Within the QMS, a decision is made as to the proportion of fish that can be sustainably harvested. This TAC[6] is apportioned between recreational, customary and commercial fishers and the proportion of total catch allocated to each group differs by species and area. For example, in an area with high population density such as Tīkapa Moana the Hauraki Gulf, the recreational allowance for snapper is a significant proportion (estimated at 40% in 2020). In many other fisheries, the majority of the TAC is provided for commercial interests. We do not explore this further, but focus on the commercial catch.

Summary of catch allocation. Image credit: Fisheries New Zealand. Click to enlarge.
On introduction of the QMS, ITQs were allocated to different parties based in part on historic catch levels. The holders of ITQs have a right to fish a share of the total allowable commercial catch (TACC) of a particular species that can be caught in a particular area each year, or may sell their ACE to fishers.
Each year, the TACC is proportioned to quota holders who have a right to harvest a proportion of the total TACC. This is illustrated in the figure above.
Almost all commercially fished stocks are already in the QMS. In 2019, there were 388 in total.[7] Additional stocks can be added to the QMS via Section 18 of the Fisheries Act 1996, guided by the Introduction Process Standard. The Fisheries Act 1996 requires stocks to be introduced to the QMS if the existing management is not ensuring sustainability or providing for utilisation, unless another sustainability measure would better provide for the stock.[8]
Harvest Strategy Standard
The Harvest Strategy Standard dates from 2008 and applies to all fish under the QMS and guides the way that fish stocks are managed (illustrated in figure on right).[9] It is how the statutory requirements for stock sustainability, provided in Section 13 of the Fisheries Act 1996, are implemented in practice (but does not itself have statutory recognition). The Harvest Strategy Standard states that stock targets and limits should be set more conservatively for stocks where information is sparse or uncertainty is higher.
The Harvest Strategy Standard states that stock targets and limits should be set more conservatively for stocks where information is sparse or uncertainty is higher… The key aspects of the standard are all contested.
The standard, developed in 2008, is intended to provide a consistent and transparent framework for decision makers. Not all stocks have had a target set.
Three key aspects of the standard are below and are all contested. More information on how these limits are set is included in the rest of this section.
- A specified target abundance about which a fishery or stock should fluctuate.
- A soft abundance limit that triggers a requirement for a formal, time-constrained rebuilding plan.
- A hard abundance limit below which fisheries should be considered for closure.

Summary of how fish stocks are managed based on the Harvest Strategy Standard. Note these are the default proportions and may vary by stock. Click to enlarge.
Stock assessments are both challenging and challenged
Fisheries New Zealand calculates how much of a particular stock can be caught each year through a stock assessment process. The aim is for stocks to be managed to a target level – a level where a fish stock can fluctuate around a balance between use and sustainability. This assessment is simple in theory but relies on science that is inexact and uncertain.
This assessment is simple in theory but relies on science that is inexact and uncertain.
In particular, the following key inputs are all uncertain:
- How many individual fish there are currently in each stock (see ‘Performance of stocks’).
- How many fish there would be if none had been harvested (see ‘Original biomass’).
- The portion of the current stock that can be sustainably harvested (see ‘Maximum sustainable yield’).
- The degree of damage removal of these species does to wider ecosystem (‘Fishing effort has wider ecosystem impacts’ section).
All of these factors are hard to measure and understand, which underpins both how challenging the fisheries management field is, and how much it is challenged.
All of these factors are hard to measure and understand, which underpins both how challenging the fisheries management field is, and how much it is challenged.
The assessment process factors in data such as self-reported catch and bycatch from commercial fishers, observer data, fisheries-independent research data (such as data from research vessels), and CPUE (see section: ‘The relationship between catch per unit effort and abundance’), which is integrated via stock assessment models where these are available. This also includes consideration of levels of illegal/unreported fishing. The stock assessment process is not uniform across each stock – the availability of data is highly variable and the approaches used also differ. There are numerous stocks that are not assessed due to a paucity of data (discussed further below).
The stock assessment process is not uniform across each stock – the availability of data is highly variable and the approaches used also differ. There are numerous stocks that are not assessed due to a paucity of data.
Even for stocks with adequate data, there are inherent uncertainties relating to the use of models in a variable biological environment. All stock assessment analyses in Aotearoa New Zealand are peer-reviewed by Fisheries New Zealand using fisheries assessment working groups that include a range of science and industry experts as well as Fisheries New Zealand managers and other stakeholders. Working groups are technically open to anyone who agrees to the terms of the reference.[10] However, the often limited data and lack of trust in the decision-making process can create tension around stock assessments. This is reflected in criticism of the process that we heard from a variety of sources.
There have been times when industry has adopted more conservative catch limits than what they have been afforded because the data is lacking or not providing a reliable assessment of the stock status, or because they want a quicker rebuild to higher catch rates. In these cases a portion of the annual allowed catch is shelved. Conversely, there have also been instances where industry have mounted successful legal challenges in response to decrease in catch limits (e.g. orange roughy[11] in northern New Zealand).
Throughout these processes, the focus is primarily on the sustainability of individual stocks. Section 9 of the Fisheries Act 1996 also requires environmental principles to be taken into account (see ‘Environmental principles’), although the extent to which this occurs in practice is variable (see sections ‘Actioning the use of habitats of particular significance for fisheries management’ and ‘We need a plan for our oceans’).
When a stock hits the soft limit, it is considered to be depleted or overfished and needs to be actively rebuilt, generally by reducing TAC of the stock. The timing of the rebuild can be a matter of contention.
Despite Fisheries New Zealand aiming to keep stocks at a target level, it is not universally achieved for measured fish stocks, and not all fish stocks are routinely measured (see figure below).

The status of fish stocks relative to the target level as reported by Fisheries New Zealand in 2020.
Performance of stocks
The key assessment of stock sustainability is undertaken by Fisheries New Zealand annually and published on their website. There are many differing reports of how many stocks are actually assessed.[12] Note that nominal stocks are discussed below.
The figure above shows the assessment of stocks by Fisheries New Zealand against the ‘target level’ or ‘management target’ criteria. The figure shows that around half of the QMS stocks were likely, very likely or virtually certain to be at or above target levels. When considering only scientifically assessed stocks this equates to around 82%. A significant proportion were about as likely as not to be at or above target levels, while the minority were likely to be below.
While in 2019 there were 160 stocks that were scientifically evaluated, there were also 228 stocks (and almost 300 nominal stocks)[13] that were not assessed.[14] When stocks are not assessed, it is not possible to comment on their sustainability under our fisheries management regime. Of the stocks that are assessed, the time since last assessment also varies widely. While many have been completed in the last few years, others have not been assessed in over ten years.
The figure on the right provides a comparison of stock sustainability by number of stocks, catch volume and catch value. This indicates that the stocks assessed are those with higher catch volumes and/or higher catch value. Further discussion is provided on stock performance below.

Fish stock status in 2019. Data from Fisheries New Zealand. Click to enlarge.
When stocks are not assessed, it is not possible to comment on their sustainability under our fisheries management regime. Of the stocks that are assessed, the time since last assessment also varies widely. While many have been completed in the last few years, others have not been assessed in over ten years.
Discards
Discards in fisheries refers to any fish that are landed but subsequently returned to the ocean. Discarding can refer to both legal and illegal actions, as there are rules that commercial fishers must follow around discarding, including the reporting of discarded catch. Generally, fish that are managed under the QMS must not be discarded.
Generally, fish that are managed under the QMS must not be discarded.
Commercial fishers who catch more fish than their ACE may be charged the ‘deemed value’ of the extra catch (if they cannot buy more ACE to cover it). The deemed value is calculated using a rate set by Fisheries New Zealand for each fish stock in the QMS and the deemed value is higher than the cost of buying ACE, to discourage intentionally fishing outside catch entitlements.[15]

An example of fish washed ashore that may have been illegally discarded.
Some fish must be discarded – for example, when they don’t meet minimum legal size limits (as for recreational fisheries). However, there are also circumstances where discarding may be illegal – e.g. of small fish (above the legal minimum size) or of catch where quota levels have been exceeded.[16] Where deemed values are high, this can create an incentive to discard catch to avoid these fees and is reportedly common in some fisheries.[17]
Where deemed values are high, this can create an incentive to discard catch to avoid these fees and is reportedly common in some fisheries.
Fish that are discarded may be dead already or may not survive after being released, so the resource is not being utilised. Fishing more selectively to avoid the need for discards and reducing mortality of fish upon landing (so that they can be returned unharmed) are challenges that research and innovation efforts need to address (see section ‘How we fish’).
There is limited trusted data and information on discards, particularly in inshore fisheries where observer coverage is low, meaning there is little available quantitative information on the level of discards occurring.[17] Discards are monitored by observers on deepwater fisheries and estimates are made of total discards.[18] Discards estimates often rely on assuming similarity between observed and unobserved behaviour when it comes to discarding and recording.[18] Anecdotally, there are reports that illegal discards are increasing due in part to market demands and the availability of ACE.[17]
Discards pose an ongoing challenge for regulators, although policy changes are currently underway (see section ‘Policy changes are underway’) there is likely further work needed to reduce perverse incentives to discard illegally, as is happening overseas.
Although policy changes are currently underway, there is likely further work needed to reduce perverse incentives to discard illegally.
Original biomass
As presented in the figure above, many of the calculations of abundance and the soft and hard limits are in relation to the original biomass of a stock. This is the expected biomass in the absence of fishing. This makes the calculation of original biomass incredibly important because it is against this calculation that sustainability is measured.
Of course, in most cases the original biomass is not something that has been quantitatively observed. For some species there may be catch records that stretch far enough back in time (particularly when good records are kept from the beginning of extraction in that fishery), while for other species or stocks there is limited or no data. Fishing had already impacted on fish stocks when the QMS was introduced in 1986 (which was part of the reason for introduction), yet much of this fishing effort was unquantified (see figure to the right).[19]

Estimated total catch (all species) along the east coast of the South Island (FMA3) in 1977, compared to catch levels in 2019. As reported in [19].

Trevally/araara (Pseudocaranx georgianus) work-up. Image credit: Zinzi/iNaturalist (CC BY-NC 4.0).
Fishing had already impacted on fish stocks when the QMS was introduced in 1986, yet much of this fishing effort was unquantified.
Calculation of the original biomass is uncertain. A variety of models can be used, depending on the available data. In many cases this modelling is complex with methodologies that are not easy to follow for non-fisheries experts. Uncertainty lies in the underlying data, in the complexity, and in the modelling approaches available. The resulting error bars in the model estimates of stock status therefore present a management challenge. This can lead to dissent (see the example discussed in the case study: Mixed messages: Are we overfishing our rock lobsters?).
Different models with different methods and different assumptions may produce significantly different estimates of biomass. For example, the range of model estimates may suggest the stock might be between 10% and 40% of original biomass. This can cause friction between stakeholders as where the stock sit within this range could trigger different management actions, from immediate closure (if at 10%) to no action (if at 40%).
Maximum sustainable yield
The Fisheries Act 1996 requires that the TAC is set at a level that maintains the stock at or above a level that can produce maximum sustainable yield (MSY) or proxies thereof. MSY is defined as the greatest yield that can be achieved over time while maintaining the stock’s productive capacity, having regard to the population dynamics of the stock and any environmental factors that influence the stock (figure to the right). The use of MSY is based on Fisheries New Zealand’s interpretation of international best practice in the context of Aotearoa New Zealand. An alternative measure used by some other jurisdictions, including Australia, is maximum economic yield.
MSY is defined as the greatest yield that can be achieved over time while maintaining the stock’s productive capacity.

Calculation of maximum sustainable yield from Fisheries New Zealand. BMSY is the biomass that supports maximum sustainable yield, B0 is the original unfished biomass. These numbers are uncertain and contested. Click to enlarge.
TACs have generally been set to achieve single-species MSY-related objectives, though there has been a move to considering these targets within the wider ecosystem context, including bycatch, discards, habitat and protected species.[17] There are criticisms of how it is currently applied, particularly given it is a theoretical construct.[20] MSY is related to several parameters, all of which are contested, specifically original biomass, current biomass (see section: ‘The relationship between catch per unit effort and abundance’), and how soft and hard limits are calculated (see section on setting catch limits). The inexact and uncertain nature of these inputs therefore limits the certainty relating to MSY.
The inexact and uncertain nature of these inputs therefore limits the certainty relating to MSY.
Nominal stocks
Nominal stocks are an obscure part of the fisheries system to many stakeholders. It can be difficult to ascertain the importance of these stocks as, while the general reasons for excluding stocks is provided, it is not provided on a stock-by-stock basis publicly.
There is no stock status data provided for nominal stocks. In the system they represent stocks with:
- Zero TACs or TACCs.
- Small or zero annual catches (generally less than 10-20 tonnes) where there is:
- No commercial or recreational development potential.
- No current demonstration of customary or ecological importance.
- An ‘administrative presence’ only, e.g. to account for fish that stray into an area in which they are generally absent.

Kina and Australasian brown sea cucumber (Australostichopus mollis).
As our oceans warm, there could potentially be many changes to stocks that were once only an ‘administrative presence’. Fish may eventually move en masse into a QMA in which they were previously rare (see ‘Climate change is a huge threat to our oceans’). Fisheries New Zealand expect to respond during periodic reviews of the classification of stocks as ‘nominal’ that occur every few years. There might be a need for more frequent action as oceans warm.
This process is less formal than some others undertaken by Fisheries New Zealand but has been described by their fisheries scientists as following a general process, shown below. In collaboration between science and management teams within Fisheries New Zealand, there are a series of rules consulted for continuing to deem a stock as nominal. Every few years the nominal stocks are judged against these rules. These rules are necessarily somewhat subjective and flexible, generally:
- For most moderate-to-high-volume inshore stocks, current and historical catches have rarely if ever exceeded about 10 tonnes in any given year (TACCs or TACs may exceed this amount, but catches are what count the most).
If this process were reported on more publicly then this increased transparency may allow greater comfort to stakeholders. Providing an opportunity to input concerns relating to nominal stocks may be beneficial.
- For low-volume deepwater stocks, current and historical catches have rarely if ever exceeded about 10 tonnes in any given year (TACCs or TACs may exceed this amount, but catches are what count the most).
- For most moderate-to-high-volume deepwater stocks (which tend to be caught in much larger quantities than most inshore stocks), current and historical catches have rarely if ever exceeded about 20 tonnes in any given year (TACCs or TACs may exceed this amount, but catches are what count the most).
- For some high-value, low-volume inshore stocks (e.g. kina, sea cucumber, where a low volume could nevertheless be quite valuable), a lower cut-off might be more reasonable (for example, 2-5 tonnes).
- For some species with zero or very low catches, it may nevertheless have been demonstrated at some point in time that an appreciable abundance of a given species exists, e.g. several surf clam[21]
- For some species with very low commercial catches, there may nevertheless be moderate-to-high value to recreational fishers, e.g. yellow-eyed mullet/kātaha[22] in areas one and nine, or they may be locally important to iwi or others.
Stocks that have been included in stock status tables never become ‘nominal’, regardless of whether commercial catch decreases or stock range changes.
If this process were reported on more publicly then this increased transparency may allow greater comfort to stakeholders. Providing an opportunity to input concerns relating to nominal stocks may be beneficial.
The relationship between catch per unit effort and abundance
It is extremely difficult to gain accurate measurements of the total number of fish in each stock. This means that proxy measurements must be used, and these are often contested. CPUE is an index of abundance sometimes used in Aotearoa New Zealand’s fish stock assessments that inform setting of TAC. At a basic level, it is the amount of catch taken by a given amount of fishing effort.
It is extremely difficult to gain accurate measurements of the total number of fish in each stock. This means that proxy measurements must be used, and these are often contested.
The unit of measurement of CPUE depends on the fishery, for example it can be measured in kg-per-day, kg-per-tow, or other measures.
Conceptually when abundance of a stock increases, the effort required to catch a standard amount of fish should be lower, and vice versa.
However, measuring effort (and thus relative abundance) is not straightforward and so the CPUE may not reliably reflect abundance. For example, if increased fisher experience or improved fishing gear technology (both of which are difficult to measure) makes it easier to catch fish, this will impact the calculation of CPUE. To use a CPUE index to monitor trends in a fish stock, the assumption needs to be made that CPUE is correlated with stock abundance, yet this is not necessarily the case.[23] CPUE has been described is a commonly used metric across the fishing industry. The reason it is commonly used is because the data on which it is based is cost-effective to collect and is often used for other purposes as well, and CPUE is relatively easy to calculate and interpret. Limitations are well recognised by Aotearoa New Zealand fisheries scientists and working groups.
Measuring effort is not straightforward and so the CPUE may not reliably reflect abundance.
Once the measurement of effort has been defined, the relationship between CPUE and abundance can be calculated quite simply (as a simple ratio of catch to effort) or through a much more complex standardisation process. These more complex processes are used throughout Aotearoa New Zealand’s stock assessments and vary from stock to stock. A very simplified representation of this relationship is shown in the figure on the right.
The assumption that CPUE is proportional to abundance is not always correct. Hyperstability is a potential issue with CPUE, where CPUE remains constant despite abundance decreasing.[24] It is an often cited concern by those opposed to aspects of commercial fishing.[25] This might reflect a situation where a new technology has made it easier to catch the fish (e.g. a change in netting material or design[26] or where fish aggregate for spawning or feeding). Conversely, hyperdepletion describes a situation where abundance increases yet CPUE remains constant (e.g. all of the fish may not be available to capture[27]). The relationship between CPUE and abundance is difficult to validate because of the difficulty of collecting consistent catch and effort data over a long enough time period to compare CPUE. In Aotearoa New Zealand, we have been able to compare CPUE with time series of research trawl survey results in some areas, with mixed results (see case study: Chatham Rise is a unique fishery with consistent, long-term data).

Top: Simplified version of how CPUE is calculated. Bottom: Types of possible relationship between CPUE and abundance. The assumption that CPUE is proportional to abundance is not always correct. Adapted from Hilborn and Walters (1992).
The relationship between CPUE and abundance is difficult to validate because of the difficulty of collecting consistent catch and effort data over a long enough time period to compare CPUE.
Some fishers have challenged whether CPUE accurately incorporates fishing effort as they perceive it does not take into account the changes in their equipment use, the areas covered or how they target fish.[20] CPUE aims to be applicable across a fleet and therefore will not always reflect a fisher’s individual experience well.
There appears to be consensus that in many situations CPUE data may not accurately represent stock abundance, but if appropriately measured it can be a useful input into understanding abundance trends in a given fishery in the absence of alternative measures.[28] One role of the fisheries assessment working groups is to guide the CPUE analyses, assess how reliable CPUE data is when deciding how to incorporate it into full stock assessment models, and determine whether they credibly reflect stock abundance. It is therefore crucial that these working groups operate in a way that builds trust in the independent scientific assessment process.
There appears to be consensus that in many situations CPUE data may not accurately represent stock abundance, but if appropriately measured it can be a useful input into understanding abundance trends in a given fishery in the absence of alternative measures… It is therefore crucial that these working groups operate in a way that builds trust in the independent scientific assessment process.

Snapper, Northland. Image credit: Icolmer/iNaturalist (CC BY-NC 4.0).
The credibility of CPUE indices varies greatly between stocks. In 2019, a Fisheries New Zealand report on the West Coast South Island (HAK7) fishery for hake/kehe[29] concluded that CPUE indices conflicted greatly with research trawl surveys and were not a reliable index of fish abundance. In this example the CPUE data was not used in the stock assessment given the level of uncertainty in its reliability.[30] Trawl survey for this stock was also treated with low confidence (as trawl survey in this case was also quite unreliable).
The credibility of CPUE indices varies greatly between stocks.
In comparison, other fisheries such as snapper in SNA8, found that CPUE modelling was robust enough to account for changes in trawl gear and for changes in fisher behaviour.[31] In this case, given the importance of the fishery, further independent trawls were contracted to help ensure the data used to assess the stock was as robust as possible.[32]
Some examples of factors that impact on the calculation of CPUE include:
- Catch equipment used. E.g. cod-end size and length, door spread and length of sweeping gear. This is explored in depth in the case study: Pāua fisheries and industry-led management.
- Experience and skill. E.g. an experienced skipper may be able to more easily locate and catch fish than a newer skipper.[26]
- Practices used. E.g. vessel speed: a net that is trawled more slowly will typically catch fewer snapper [31, 33] (see case study: Mixed messages: Are we overfishing our rock lobsters?).
- Locations fished. E.g. seamounts and spawning aggregations can have dense aggregations of orange roughy.[34]
- Water temperature. E.g. warmer surface waters may lead to deep-diving species like bigeye tuna[35] avoiding gear,[36] or species moving elsewhere.
- Changes in weather. E.g. an increase in storms and waves (and consequently water turbidity) can reduce hook and line catch rates.[37]
- Market. E.g. the desire to avoid paying deemed values may lead to avoidance of some species (e.g. snapper) to minimise high deemed value payments.[38]
- Behaviour of the target species. E.g. moulting and reproductive behaviour of scampi varies between the sexes and seasonally, impacting catch rates;[39] aggressive species can be easier to trap as they tend to guard bait, increasing catch rates.[40]
- Interrelated fisheries. E.g. fishers may change their fishing location to a less optimal area if a protected species would otherwise be present where the fish were greatly abundant. In practice this would decrease CPUE and indicate a lower abundance of fish, instead of reflecting fishers’ behaviour in avoiding areas of greatest abundance.[15]

New Zealand scampi. Image credit: krl krl/Flickr (CC BY-NC-ND 2.0).
Improvement in data collected on fishing gear and fishers experience could include information on areas such as:
- Door spread,
- Ground gear rope length,
- Sweep and bridle lengths,
- Cod-end mesh size and orientation,
- Number of years a skipper has been involved in the fishery.
Experts in fisheries science consider many of these factors when calculating standardised CPUE; for example, changes in areas fished, gear use, tow speed and other species caught can all easily be taken into account. Skipper experience, fishing gear and operational factors not recorded in logbooks can often be accounted for by including a vessel effect in the model. Experts can then assess the reliability of CPUE and other data to incorporate into full stock assessments.
A suggestion from Te Ohu Kaimoana has been that some issues with CPUE could be reduced if the setting of catch limits included a consultation process where ‘on-the-water’ operational information was considered that otherwise are not considered or communicated in model outputs.[15] Te Ohu Kaimoana has also suggested that in interrelated fisheries, portfolios of stocks could be built and evaluated simultaneously to improve groundtruth assessments based on CPUE building on current analyses in inshore finfish stocks.[15]
Seafood New Zealand has commented that although the use of CPUE has shortcomings, alternatives such as the use of fishery independent surveys also have many issues and uncertainties and are often prohibitively expensive in comparison.
Fisheries plans
Fisheries plans are a tool used to bridge the different pieces of legislation, policies, strategies, and regulating authorities to guide action at a more refined scale and measure progress (see figure on right). They are provided for under Section 11(a) of the Fisheries Act 1996 and can enable stakeholder-led management (where a plan is approved by the Minister of Fisheries). Fisheries plans provide overarching frameworks (over a five-year timeline), from which (non-statutory) Annual Operational Plans are developed and Annual Review Reports produced.
Implementation of these plans is in two repeated stages – the first is detailing management actions for the year, including the required services that must be delivered by the ministry, and the second involves assessing and reporting on performance of the fisheries against what was planned. The plans are intended to be informed by the:
- Harvest Strategy Standard and QMS Introduction Process Standard (see ‘Setting catch limits and allocating catch allowance’),
- International Fisheries Strategy,
- Treaty Strategy,
- National plans of action and threat management plans (see ‘Bycatch of non-target and protected species’), and
- Iwi Fisheries Forum Plans.
Implementation and consistent review and update of these plans is variable and is discussed further in this section.

How fisheries plans fit into the wider context – (adapted from Fisheries New Zealand, 2019).
Fisheries New Zealand has several key fisheries plans, which include:
- Inshore finfish fisheries (draft only),
- Deepwater and middle-depth fisheries, and
- Highly migratory species fisheries.
National Fisheries Plan for Inshore Finfish Fisheries is still under development
In 2020, Fisheries New Zealand consulted on a Draft National Inshore Finfish Fisheries Plan for the fisheries extending out to 12 nautical miles (the territorial sea).
A draft plan was previously developed in 2011, but never finalised.[41] The 2011 plan was reported by Fisheries New Zealand as having been trialled over a period of years and feedback sought. It does not appear that Annual Operational Plans and Reviews have been consistently produced in the years between 2012 and 2020.
The draft plan for consultation in 2020 identifies focus areas and high-level management objectives, and is supported by other plans and strategies, providing the overarching framework for the management of the fisheries for the next five years. Many of the approaches outlined in the plan have the aim of progressing Aotearoa New Zealand towards an EAFM. Particularly:
- Integrated management of multiple individual stocks in the fishery.
- Increased opportunities for engagement and active participation in management of fisheries for iwi and Māori.
- Improving environmental performance, particularly protecting habitats of significance from impacts of fishing and land-based effects.
It is important that an inshore plan is actually implemented.
National Fisheries Plan for Deepwater and Middle-Depth Fisheries
In 2019, Fisheries New Zealand finalised a National Fisheries Plan for Deepwater and Middle-depth Fisheries. Deepwater and middle-depth fisheries occur in water depths between 200 and 1,500 m and are located between the 12 nautical mile limit out to the edge of our EEZ.
The plan provides strategic direction for managing deepwater fisheries and an integrated and transparent way of defining management objectives. Management of deepwater fisheries is by collaborative agreement between Fisheries New Zealand and industry representative body Deepwater Group. Fisheries New Zealand retains all statutory responsibilities. Management objectives outlined in the plan are provided in appendix 10.
Annual Operation Plans have been produced for deepwater fisheries in 2012/13 and the years from 2015 through 2019.
National Fisheries Plan for Highly Migratory Species Fisheries
In 2019, Fisheries New Zealand finalised a National Fisheries Plan for Highly Migratory Species. The plan establishes objectives for managing highly migratory species (fish that swim large distances), mainly impacting fisheries with the EEZ (12-200 nautical miles). There are additional obligations than those of inshore, deepwater and middle-depth fisheries, due to Aotearoa New Zealand’s participation in international agreements (see appendix 10).
Key species covered in this plan include large pelagic species (like southern bluefin[42] and bigeye tuna and swordfish/paea[43]) caught in surface longline (as well as non-target species such as moonfish/opah[44] and pelagic sharks), caught by purse seine, and albacore/longfin tuna[45] (mostly caught by trolling).
Targeted management plans exist but are implemented with varying degrees of success
Below are the management plans listed on Fisheries New Zealand’s website in 2020.
Management plans for protected or threatened species were outlined in the ‘Bycatch’ section.
Snapper 1 management plan
There is a Snapper (SNA1) Management Plan as there is a need to increase the biomass of the snapper population in order to meet the needs of future generations and protect the environment that snapper productivity relies on. The plan sets out a range of measures to: reduce waste and improve productivity; improve monitoring and management of the SNA1 fishery; improve reporting and understanding of snapper habitat and environment; and implement and monitor the plan.
National blue cod strategy
There is a national blue cod strategy as management issues for the species have developed in several areas around the South Island, with different regions identifying different management approaches. Issues to be addressed by the strategy include illegal take, TAC, commercial pot mesh size, released fish mortality, localised depletion, timing of fishing season, and habitat loss.
Rock lobster (CRA2)
There is a multi-staged rebuild plan in place to improve the abundance of rock lobsters in the CRA2 fishery due to the low abundance of the stock. A scientific assessment in 2017 found the number of rock lobsters in the fishery had dropped to levels where management action is required to ensure it rebuilds. TAC for the fishery was significantly reduced in 2018, this was followed by a halving of the bag limit from six to three, and the introduction of telson/tail clipping to reduce illegal catch. This fishery is further discussed in the case study: Mixed messages: Are we overfishing our rock lobsters?
Southern scallop fishery (SCA7) strategy
A southern scallop fishery strategy has recently been finalised. In the meantime, the SCA7 fishery remains closed. The stock has struggled to recover to a healthy and sustainable biomass level. The priority of the SCA7 strategy is to ensure that any future scallop fishing in Te Tauihu-o-te-waka the Marlborough Sounds is sustainable and allows the fishery to rebuild to healthy levels. This will involve understanding non-fishing impacts on scallops as well as improving scallop habitat quality and quantity in Te Tauihu-o-te-waka the Marlborough Sounds. This fishery is discussed further in ‘Fishing impacts on habitat’, and ‘Managing stocks with incomplete data’.
East coast tarakihi fishery rebuild
There is a rebuild plan for the east coast tarakihi fishery. This is comprised of ministerial decisions to reduce catch limits by 30% and a range of other measures within an industry-led plan. This industry-led voluntary plan focuses on improving fishing methods and undertaking research to better understand the east coast tarakihi fishery including: improving verification of commercial fishing data, closures to known nursery grounds, agreement to leave fishing grounds when large numbers of juvenile tarakihi are encountered, testing new gears to reduce the catch of juvenile tarakihi; gathering better data on the sizes of tarakihi caught in the commercial fishery, and evaluation of management strategies to determine how each of these various initiatives can contribute to rapid rebuilding of this stock.
Commercial fishing has impacts on target species sustainability
Aotearoa New Zealand’s total annual commercial marine catch peaked in the late 90s at around 650,000 tonnes and since then has remained at around 450,000 tonnes per year.[12]
This section explores:
- Known impacts of fishing on the sustainability of target stocks.
- Data collection on target stocks and accessibility of this information.
- Reporting and performance of stocks in 2020.
Commercial fishers use a number of different fishing methods including trawling, seining, netting, dredging, longlining, hand lining, jigging, trapping, potting, diving, and hand gathering. The impacts of different fishing methods on the marine environment were illustrated in ‘Most common commercial fishing methods’. Here we focus only on the impacts on target species.
The figure on the right shows the fish stocks with the highest reported commercial catch in 2019 by volume. The HOK1 stock, which covers all of Aotearoa New Zealand (except for Rangitāhua the Kermadec Islands), was the highest catch by volume and is the top commercial fish for deepwater fishing. These top stocks by volume are all from deepwater fisheries.
By species, the highest reported volume of commercial catch in 2019 is similarly dominated by deepwater species, though some species also have a significant inshore component such as jack mackerel. Other key inshore species by volume include snapper, tarakihi, red gurnard/kumu[46] and trevally/araara.[47, 48]
By value, rather than volume, other stocks rank more highly, such as rock lobster.
Business and Economic Research Ltd (BERL) reports that 54 key species account for 93% of the total commercial fishing catch (between 2010 and 2015).[48] This means that around half of the 98 species included under the QMS account for 93% of catch volume. The 98 species included in the QMS are divided into 642 separate fish stocks for management purposes.[49]
Known impacts of fishing on the sustainability of target stocks
Maximising benefits from commercial fishing means ensuring that negative impacts are managed to allow safe and sustainable use of the resource, without overfishing.
Worldwide, perspectives on the state of biomass of popularly consumed fish species are opposing, with some estimating biomass to be in decline while others debate this.[50–52] Overfishing (whether commercial, customary or recreational) – removing too many individuals from a stock – can lead to decline or even collapse (either of an individual stock or the wider ecosystem). A fish stock is generally described as collapsed when it is at a very low abundance, often theoretically defined as 10% of the unfished stock, including by Fisheries New Zealand (their ‘hard limit’).[53] These definitions are contested (see ‘Fisheries management involves the use of many different tools’).
How well a particular fishery can cope with losing a proportion of its population each year depends on the amount taken, but is also subject to wider cumulative effects (as described in ‘Fishing is one of many stressors on our oceans’).
Both large, predatory fish and small, forage fish may be vulnerable to collapse, although the former tend to exhibit long, slow declines while the latter tend to exhibit cyclical periods of growth and collapse that can span orders of magnitude in size.[54] Many sharks and rays are vulnerable because they mature later, have a long gestation period, and have fewer offspring.[55] Larger fish are also more likely to be migratory, meaning they may seasonally inhabit fisheries within many different nations and, as a result, efforts to manage fishing need greater coordination to be effective (see ‘Fisheries plans’). Small pelagics can also inhabit fisheries within many different nations given their size and can number in the tens or hundreds of billions and they therefore cover very large areas.
In 2020, Fisheries New Zealand reported on 160 stocks, of which nine were reported as ‘collapsed’ (see table below). There are few well-documented cases of marine species becoming extinct from being overfished.[56–58] Generally, fish would cease to be harvested at commercial scale before this point as it would no longer be economically viable. This risk is potentially realisable in fisheries where catch method lacks species specificity.[53, 59, 60]
What is more common is ‘ecological extinction’, where a species is at such low abundance that it is no longer interacting significantly with other species in an ecosystem.[61] This term has been used in some areas of Aotearoa New Zealand to describe rock lobster populations.[62] So while complete extinction of a fish species we catch is perhaps unlikely, there can be considerable alterations to marine ecosystems. Impacts of fishing on marine ecosystems are discussed in ‘Fishing effort has wider ecosystem impacts’.

Catch volume – stocks (data from Fisheries New Zealand).

Catch volume – species (data from Fisheries New Zealand).

Recent harvest.
Data collection on target stocks and accessibility of this information
A significant proportion of data collection and research that Fisheries New Zealand and the commercial fishing industry undertake, funded through levies, is focused on fished and targeted commercial species and stocks. This is because the data is needed to undertake stock assessments under the Fisheries Act 1996. This data is very challenging and very expensive to obtain and we have incomplete and uncertain information. Cost recovery (e.g. for data needs) and funding for research needs are discussed further in the section below, ‘Research programmes, funding and prioritisation’. An overview of the data collected by Fisheries New Zealand is given in the boxes below.[63]
Important information required to fully understand stocks includes:

Fish stocks: stock structure
| Research | Includes biological studies on distribution, spawning areas, movements (including fish tagging), genetic and morphological differences for some stocks. |
| Significance | Important for assessing and managing stocks at appropriate spatial scales. |
| Current collection and initiatives | Much of our knowledge of fish stock structure was determined pre-QMS introduction through biological studies, patterns in commercial fisheries, and fish tagging to determine movements. Allocation of stocks to administrative QMAs in 1986 under the QMS was based on knowledge of stocks at the time for some species, or, in the case of many inshore species, limited to individual Fishery Management Areas (FMAs) that served to limit potential over-exploitation in any one area. Improvements in knowledge about stock structure over time have been dealt with in various ways under the Fisheries Act 1996, including subdividing quota area catches (usually by industry agreement, e.g. hoki, orange roughy, pāua), or amalgamating areas to be assessed if appropriate (e.g. school shark, tarakihi). Catch and effort splitting is also undertaken by industry. Stock structure issues continue to be challenging for many of our fish stocks and more focused research is required to address this. Lack of knowledge on stock structure can lead to considerable uncertainty in stock assessment and management. Current initiatives include biological studies, analysis of trends in survey and commercial fishing data, tagging (currently limited to a few species). |
Fish stocks: stock size
| Research | Monitoring and estimating the size of fish stocks (the ‘biomass’ of a fish stock). |
| Significance | Estimates of the size of fish stocks are a key component of assessing whether a stock is being fished at a sustainable level. |
| Current collection and initiatives | Time series of research trawl and/or acoustic surveys spanning nearly 30 years in the inshore (east and west coast of the South Island, snapper fisheries of the west and east coasts of the North Island) and deepwater fisheries for hoki, hake, ling/hoka[64], southern blue whiting, orange roughy (Chatham Rise, subantarctic, west coast of the South Island). Time series of commercial catch and effort data spanning 30 years in inshore (event-based since 2007) and deepwater (event-based since 1989). Observer sampling of deepwater fisheries target and bycatch since 1986. Catch sampling in fish processing plants for inshore (snapper, tarakihi, trevally, blue cod, albacore, jack mackerel, rock lobster) and deepwater (hoki) species, to collect fish length data and otoliths for ageing. |
Fish stocks: stock productivity
| Research | Age, growth and reproductive capacity of species we fish. |
| Significance | Allows for determination of patterns and variability in age and growth, longevity and recruitment of species we fish (the productivity of a stock informs our approach to balanced management). |
| Current collection and initiatives | For some key commercial species, comprehensive biological data is collected through research surveys and studies, commercial catch sampling by observers and in fish processing plants collect fish size and otoliths for ageing. There are also industry logbook programmes (e.g. rock lobster) where measurements are recorded. For other commercial species, little to no data is collected, which means that variability in reproduction, growth patterns and recruitment (i.e. productivity) are poorly understood for most species. |
Fish stocks: fishing mortality
| Research | Mortality information for species we fish based on catch data. |
| Significance | Accurate catch data are important to determine fishing mortality in stock assessment models. |
| Current collection and initiatives | Long-term fisheries-related datasets are primarily in the form of fish landings, which provide a valuable resource.[12] Fish landings data includes commercial catch, effort and location data spanning 30 years in inshore (event-based since 2007) and in deepwater (event-based since 1989). There are also over 30 years of Fisheries New Zealand observer data verifying commercial catches in deepwater fisheries, for a subset of the fleet. |
As summarised above, there is biological data collected on some key commercial species through a number of different methods, although the focus of this research is on the more economically valuable species. Data collection on key deepwater species is carried out annually, while data collection by observers allows for data collection through key fishing seasons.
Much of the data relied on (i.e. landings, bycatch) is self-reported and may not be seen as independent. Misreporting can be incentivised in some instances under the QMS and there are examples of misreporting occurring, see for example [65–68]. There are other initiatives underway through Fisheries New Zealand’s Fisheries Change Programme that hope to address this issue. For example, introducing mandatory electronic catch and position reporting to improve collection and reliability of fisheries information, incentivise better fishing practices, improve monitoring and verification capabilities and use on-board cameras. It is also important to point out that self-reported data is currently verifiable to an extent – reporting requirements provide a documentation trail of the catch and production flow process, which requires reporting at multiples stages, usually by multiple parties. These reporting requirements reduce opportunities for potential misreporting (because discrepancies could be detected), particularly where multiple companies are involved in the supply chain.
There are a number of new scientific methods or innovative applications of existing methods that could be applied to deepen our understanding of fish stocks in Aotearoa New Zealand – these are discussed in ‘A future focus: Science, technology and innovation’. Research trawl surveys, although often targeted, can collect a vast amount of data that could be analysed and used more widely than for specific stock assessments.
Data and fish stock boundaries
Stock structure understanding is vital for assessing the sustainability of a fishery. How stocks are defined and managed by the regulator may not always reflect natural fish stock delineation (e.g. where they are separated by temperature changes or geographical features), especially with stock movement due to climate change (see ‘Climate change is a huge threat to our oceans’).
In Aotearoa New Zealand, fish stocks are allocated spatially to QMAs under the QMS and may not necessarily align with the natural boundaries of fish populations. Stock structure management continues to present a challenge and more focused research to better determine stock relationships is required for many species.
Stock structure understanding is vital for assessing the sustainability of a fishery. How stocks are defined and managed by the regulator may not always reflect natural fish stock delineation.
While some stock challenges are recognised and allowed for under the management system (e.g. the school shark, which is considered to be one stock but management by smaller FMAs limits potential overfishing in any one area), some issues cause significant assessment uncertainty.
For example, although the QMS has one defined hoki stock covering most of Aotearoa New Zealand’s waters (HOK1), it is managed as two sub-stocks – eastern and western. There have been concerns from commercial fishers that the annual stock assessment was not consistent with the performance of the fishery, i.e. that fish catch rates are declining in the western area despite high stock estimates.[69, 70]
Research on the eastern and western hoki stocks found that they are both located in multiple areas throughout the year (including both stocks in the same area at the same time). However, there is no tagging data available to estimate movement rates[71] and this means the modelled assumption for hoki are very uncertain.[72] The lack of tagging data for hoki is because tagging requires fish to be brought to the surface, but hoki have very low survivability on being brought to the surface, making tagging not viable. While stock structure understanding is needed for assessing the sustainability of a fishery, decisions need to be made ahead of full understanding.
Fisheries New Zealand has a range of research underway to further inform the 2020 hoki stock assessment.[70] The case study on how genetics was used to delineate Atlantic Cod stocks (see case study: Real-time genetic management of a marine fishery) provides an international example of innovative techniques that can be used to manage mixed stocks similar to hoki.
Reporting and performance of stocks in 2020
Research related to fisheries is summarised annually by Fisheries New Zealand, principally in their Fisheries Assessment Plenary reports, which include the information held and used in stock assessments.[73–76] Fisheries research is also reported in the AEBAR.[77, 78]
Reporting on performance of stocks is heavily informed by catch data and the accuracy of this data varies between different fisheries. For example, there is generally much higher observer coverage in deepwater compared to inshore fisheries. Fisheries with higher observer coverage are reasonably expected to have less non-compliance regarding reporting.[79]
Managing stocks with incomplete data
As outlined in ‘Performance of stocks’ above, in 2019 the majority of assessed stocks were reported as ‘sustainable’ by the regulator (though the limits are contested – see ‘Fisheries management involves the use of many different tools’). Fisheries New Zealand reports that examples where stocks have been rebuilt under the QMS include PAU5B, CRA8, and various SNA and ORH stocks. This provides a solid base from which fisheries sustainability can be improved.
This section focuses on stocks that have not been assessed as ‘sustainable’ or have not been assessed at all. Where stocks have not had biomass projections (as is the case for many), it means that management measures are based on the assumption that past performance will be repeated in the future but the rate of change to marine ecosystems is such that this can no longer be assumed.[80]
Collapsed stocks
In 2020, nine stocks were reported as ‘collapsed’. Information on these stocks is provided in the table below. Collapsed stocks are defined by the regulator as those that are below the hard limit (see the discussion above on stock assessments as both challenging and challenged) and which may need to be closed to rebuild at the fastest possible rate.
Several of these stocks are discussed further – see ORH7B in the case study: Orange roughy stock health, SCA7 discussion in ‘Fishing impacts on habitat’, and the targeted management plans. The black cardinalfish/akiwa[81] species is also discussed further below and the discussion that follows. The reasons a stock came to be ‘collapsed’ and the resulting mitigative responses put in place are both highly contentious.
The reasons a stock came to be ‘collapsed’ and the resulting mitigative responses put in place are both highly contentious.

The pipi PPI1A stock is one of nine stocks assessed as ‘collapsed’. Image credit: Sarah Hailes/NIWA.
Stocks that were reported by Fisheries New Zealand as ‘collapsed’ in 2020.
| Species | Plenary stock | Information |
|---|---|---|
| Black cardinalfish | CDL2, CDL3, CDL4 | Black cardinalfish is a deepwater species that is slow-growing and long-lived.[82] CDL2, 3, and 4 cover the eastern side of the South Island and much of the North Island, including Rēkohu Wharekauri the Chatham Islands. Quota was introduced for these stocks in the late 90s.[83] The TACC for CDL3 has remained the same since introduction, while the TACC for CDL4 increased in the mid-2000s and has remained constant since then. In CDL2 (which has the greatest levels of catch), TACC was lowered from around 2,200 tonnes to 1,600 tonnes in 2009, 1,000 tonnes in 2010, and down to 440 tonnes in 2011 (where it has remained for the last decade). Reported catch has been consistently lower than the TACC. These black cardinalfish stocks were last assessed in 2014 and the role of this species in the ecosystem is not well understood, nor are the effects of removing current levels of catch.[83] There is little relevant information on this species available. |
| Orange roughy | ORH7B West Coast South Island | Orange roughy is a deepwater species that is slow to mature and long-lived. The ORH7B orange roughy stock, centered near the Cook Canyon, is located off the west coast of the South Island. It has been effectively closed from 1 Oct 2007, when the TACC was reduced to 1 tonne. Reported catch began to wane in the early-mid 90s, failing to match the TACC of 1,708 tonnes. The TACC was reduced in 1995 to 430 tonnes, and reduced again in 2001 to 110 tonnes. By the late 90s, the stock was believed to be well below BMSY (see figure). The stock was last assessed in 2004 (17% BMSY).[84] An updated assessment was attempted in 2007, but the assessment model predicted a rebuilding of the stock since 2000 and was thus a poor fit for the CPUE data. The catch rate had remained consistently low despite a substantial reduction in take.[85] |
| Pipi | PPI1A - Mair Bank, Whangārei harbour | Pipi are a shellfish endemic to Aotearoa New Zealand, inhabiting flat sandy beaches and estuaries. They are an important species for Māori, as well as commercial and recreational fishers. Pipi are harvested by hand. The PPI1A stock, located in Whangārei Harbour, was added to the QMS in 2004. Area closure of the Mair Bank for both commercial and recreational harvest was implemented in 2014 after the population plummeted. A survey estimated that the total pipi biomass in 2014 was 73.5 tonnes, down from 4,450 tonnes in 2010 and 10,542 tonnes in 2005.[86] MPI considered that harvesting was not the main driver of this drastic decline, and the reason remains unknown.[87] However they deemed that the fishery could not support the added pressure of fishing, and there were concerns that the bank, which protects the entrance of the harbour, could become destabilised with a reduced pipi population. Commercial harvesting ceased two years prior to the closure of the fishery, as the low abundance of pipi meant that the operation was not economically viable. |
| Scallop | SCA7 Golden Bay, SCA7 Tasman Bay | Scallops are an endemic shellfish found in sand, silt and mud around the coasts of Aotearoa New Zealand. The SCA7 scallop fishery is located across the top of the South Island in the Whakatū/Te Tauihu-o-te-waka Nelson/Marlborough region. Managing this fishery has proved challenging as stocks of scallops are naturally variable. After catch peaked in 1975, the fishery rapidly declined and was closed in 1981 and 1982.[88] When the fishery reopened in 1983, only 48 licences were issued to vessels with an annual catch limit. A ‘scallop enhancement’ programme allowed rotational fishing (fishing down followed by reseeding). The SCA7 was added to the QMS in 1992. Since 2002, there has been a substantial decline in scallop biomass and abundance in Whakatū/Nelson and Te Tai-o-Aorere Tasman Bay, as determined by annual surveys. Te Tai-o-Aorere Tasman Bay was closed to commercial harvesting in 2006. SCA7 was closed to commercial fishing in 2012 and was closed to all fishing in 2017 after a 2017 survey revealed the biomass had declined to around 100 tonnes (from 2,000 tonnes in 2002). A biomass survey occurred in 2020 to assess recovery. |
| Southern bluefin tuna | STN1 / Southern Hemisphere Stock | Southern bluefin tuna are found in southern hemisphere waters, including off southern/eastern Aotearoa New Zealand. Management of this fishery is shared between different member countries of the Commission for Conservation of Southern Bluefin Tuna (CCSBT). Individuals caught within the Aotearoa New Zealand EEZ are part of a single quota, STN1, introduced to the QMS in 2004. The last stock assessment of STN1 was undertaken in 2017.[90] It found that the stock is in a very low state, estimated to be around 9% of the initial spawning stock biomass (or 38% of the spawning stock biomass capable of producing MSY).[91] Members of the CCBST have agreed to management procedures that are designed to rebuild the stock to a reference point of 20% of the original spawning stock biomass by 2035. In 2019, recreational catch of southern bluefin tuna was reduced to one fish per person. Australian researchers performed genetic studies to understand southern bluefin tuna population dynamics to better inform international management (see case study: Genetic tagging to understand bluefin tuna population dynamics). |
| Pacific bluefin tuna[92] | TOR1 | The Pacific bluefin tuna is a tuna species predominantly found in the northern Pacific, but is migratory and visits the South Pacific (northern Aotearoa New Zealand). It is considered to consist of only one stock worldwide, managed through the Western and Central Pacific Fisheries Commission (WCPFC) and the Inter-American Tropical Tuna Commission (IATTC). The species is considered threatened, a status driven by overfishing.[93] In the Aotearoa New Zealand EEZ, the Pacific bluefin tuna is managed under the TOR1 quota, introduced to the QMS in 2004.[94] Catches from within the Aotearoa New Zealand EEZ are small compared to others across the Pacific, and the highly variable nature of the population within Aotearoa New Zealand waters means an Aotearoa New Zealand-specific stock assessment is not possible. The last stock assessment at the International Scientific Committee Plenary Meeting in July 2018 found that spawning stock biomass was increasing very slowly. There were several conservation and measurement measures adopted at a WCPFC meeting in December 2019.[95] |
Stocks that are experiencing overfishing
The content below shows stocks that the regulator has assessed as experiencing overfishing. This means that the level of fishing currently being undertaken is likely to be unsustainable for the stock. Thus there are generally management actions in place or being put in place to reduce fishing pressure (see case study: Mixed messages: Are we overfishing our rock lobsters?).
Virtually certain to be experiencing overfishing
| Species and plenary stock | Information on last assessment and management measures |
|---|---|
| Tarakihi TAR1E, TAR2 and TAR7 (east CS), TAR3 | Last assessed in 2018. The stocks are very likely to be below the soft limit. TAC reduced in 2018 and again in 2019. |
| Rock lobster CRA2 Bay of Plenty | Last assessed in 2017. Likely to be below the soft limit. Significant TACC and recreational allowance reductions in 2018. Further recreational measures currently being considered. |
Very likely to be experiencing overfishing
| Species and plenary stock | Information on last assessment and management measures |
|---|---|
| Pacific bluefin tuna TOR1 | Last assessed in 2018. Very likely to be below the soft limit and very likely below hard limit. WCPFC conservation and management measure adopted (CMM2019-02). |
| Pāua PAU7 | Last assessed in 2015. About as likely as not to be below the soft limit. TACC reduced by 50% in 2016. |
Likely to be experiencing overfishing
| Species and plenary stock | Information on last assessment and management measures |
|---|---|
| Flatfish[96] FLA3 (ESO) | Last assessed in 2015. About as likely as not to be below the soft limit. Annual in-season review. |
| Hake HAK7 (WCSI) | Last assessed in 2019. About as likely as not to be below the soft limit. TACC reduced by 55% in 2019. |
| Snapper SNA1 - East Northland SNA1 - Hauraki Gulf/BoP | Last assessed in 2013. The stocks are about as likely as not to be below the soft limit. For SNA1 East Northland, monitoring and management measures implemented in 2013; recreational bag limit reduced and minimum legal size increased. |
| Flatfish FLA3 (LSO) | Last assessed in 2015. Unlikely to be below the soft limit. Annual in-season review. |
| Oreos OEO 1/OEO3A Southland Smooth Oreo | Last assessed in 2007. Unlikely to be below the soft limit. TAC and TACC for OEO1 reduced in 2007. |
| School shark SCH3S/5 | Last assessed in 2018 – no assessment information available but unlikely to be below the soft limit. |
| John dory JDO1 (BP) | Last assessed in 2018. Very unlikely to be below the soft limit. TACC reduced in 2018. |
| Rock lobster CRA4 Hawke's Bay-Wairarapa | Last assessed in 2019. Exceptionally unlikely to be below the soft limit. TAC reduced in 2017. |
| Blue cod BCO7 | Last assessed in 2018. The stock is unlikely to be at or above target levels, but the likelihood of being below soft or hard limits is unknown. New recreational rules and seasonal commercial closure introduced 2015; new National Blue Cod Strategy being implemented; TAC may be considered for review in 2020. |
| Kingfish KIN1 EN & HG inshore | Last assessed in 2016. The stock is unlikely to be at or above target levels, but the likelihood of being below soft or hard limits is unknown. Under consideration for the 2020 sustainability round. |
About as likely as not to be experiencing overfishing
Orange roughy (ORH2A, ORH2B, ORH3A), striped marlin/takatetonga[97] (STM1), blue cod (BCO3, BCO4), elephant fish (ELE3, ELE5, ELE7), John dory/kuparu[98] (JDO1), stargazer[99] (STA5, STA7), flatfish (FLA3), pāua (PAU5D), red gurnard (GUR2, GUR3), rig (SPO3), rock lobster (CRA1, CRA3), school shark (SCH1W, SCH7, SCH8, SCHN/1E), red cod (RCO2).
Stocks that have not been assessed
There are many stocks that are not scientifically assessed at all (see figures on stocks above). Aside from nominal stocks described above, around one third of the commercial catch volume is made up of stocks that have never been assessed. While larger stocks like hoki dominate the catch volume, many species (particularly inshore species) may not be assessed due to a smaller commercial catch volume or value despite playing key ecological roles.
Black cardinalfish
As outlined above, several of the black cardinalfish stocks are overfished (CDL2, 3, 4). Despite the overfished status of CDL2, 3, and 4, there have never been stock assessments undertaken of the other black cardinalfish stocks and there is little information currently available on the species.
Catches for these stocks have not always been insubstantial, for example 2,000 tonnes of CDL1 was caught in 1996-97 (see graph on right). This is equivalent to the amount of fish caught in some of the top thirty stocks by catch volume today.
While a CPUE assessment of CDL1 was undertaken in 2002, it found that there was limited application of these models for monitoring the abundance of black cardinalfish. The report suggested the fishery should be monitored carefully.[100] In 2009 the potential risk in this stock was flagged again by Dunn[101], who suggested future research should investigate CDL1 and that black cardinalfish are likely to be a high-risk species in most areas.
In the intervening 10-20 years, the reported commercial catch in CDL1 has continued to drop steeply (see graph on right), yet further research efforts have not resulted in assessment of this stock.[102] Catch is not necessarily related to biomass (for example, a particular stock may no longer be targeted for commercial reasons), though when considered in light of other information (such as a decreasing catch rate/tow or data from trawl surveys) it is consistent with a decreasing biomass.[103] Where further information is not available on a stock to either validate or refute assumptions relating to biomass, it leaves high uncertainty around the size of the stock and the level of impact that commercial fisheries may or may not be having. It is clear that the TACC has had no active management role for this stock, as commercial catch has never come close to reaching TACC and has not reached even 15% of this limit in the last decade.
It is clear that the TACC has had no active management role for this stock, as commercial catch has never come close to reaching TACC and has not reached even 15% of this limit in the last decade.

Black cardinalfish. Image taken by Phoebe Forrester. Uploaded with permission by Mark McGrouther to iNaturalist (CC BY-NC 4.0).

Reported commercial catch and TACC allowable commercial catch for CDL1 (Black Cardinalfish Auckland (East)) from 1983 to 2019. Data from Fisheries New Zealand.
Hāpuku
The hāpuku stock in the northeast of Aotearoa New Zealand has never been assessed. The quota was introduced in the 1980s.
Hāpuku is packaged with bass (another groper species) under the HPB quota, which in 2019 had around 1,300 tonnes of reported commercial catch. The TACC of around 2,200 tonnes has never been caught. Fishers do not generally report these species separately so there is little data available on the catch of hāpuku,[104] yet fishers report that it is getting harder to catch and the juveniles have been called “the stuff of myths and legends” by divers. The species are (or were) an important top predator in coastal ecosystems.
There are many other fish stocks that are in the same situation of under-management, though the proportion of stocks at risk cannot be easily discerned.
There are many other fish stocks that are in the same situation of under-management, though the proportion of stocks at risk cannot be easily discerned.
Black cardinalfish and hāpuku provide examples of where the volume of stock caught has consistently been well below TACC (see graphs of reported catch on the right) and where a lack of information or assessment means that the performance (or lack thereof) of a stock has not been formally qualified or quantified.
They indicate that there may be more stocks below soft or hard limits (where a stock is considered to have collapsed) than what can be reported on based on current stock assessments. The scale of this potential issue is not readily identified as the majority of stocks (by number) have not been scientifically assessed.
The scale of this potential issue is not readily identified as the majority of stocks have not been scientifically assessed.

A rare sighting of a juvenile hāpuku in 2018. Image credit: divetutukaka/iNaturalist, filmed by Danielle Watson (CC BY-NC 4.0).

Reported commercial catch and TACC HPB from 1983 to 2019. Data from Fisheries New Zealand.
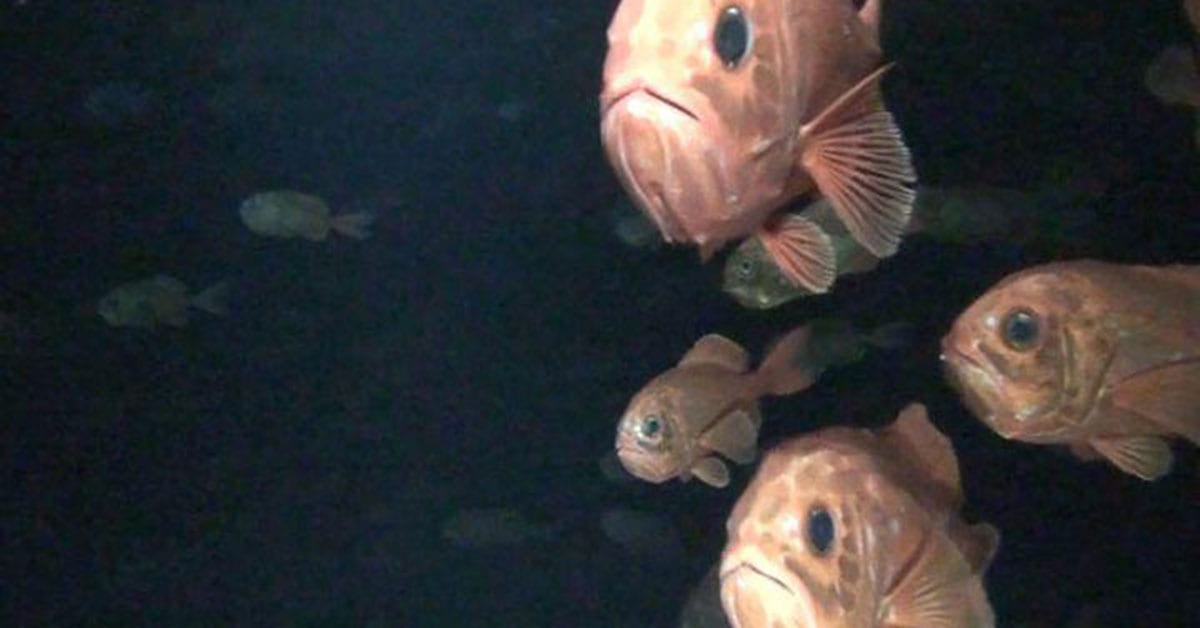
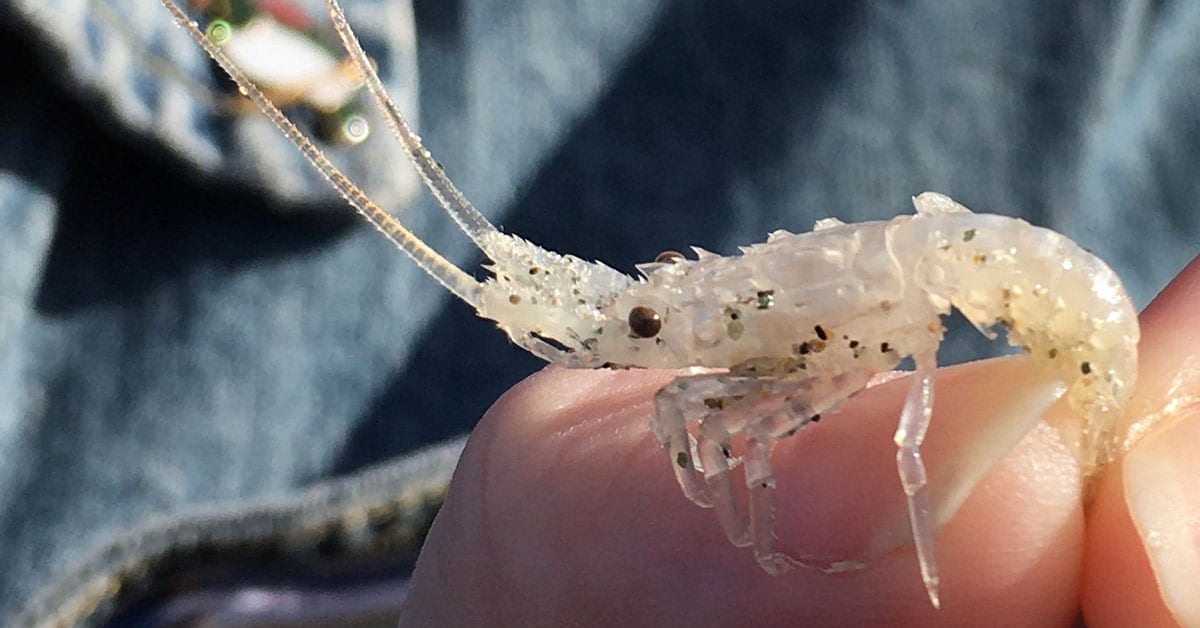

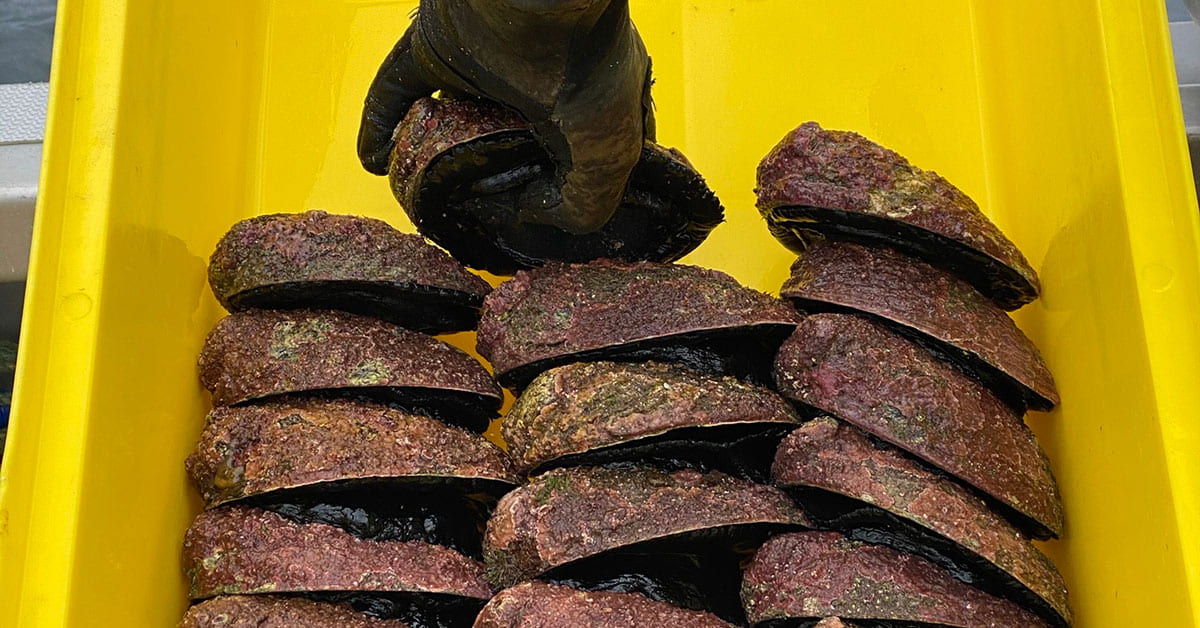
Research and regulatory initiatives are underway but poorly integrated
There are many stakeholders in the marine environment who take a range of actions or undertake research to improve the health of our marine environment and the sustainability of our fisheries. These diverse groups include commercial fishers, quota owners, industry organisations, the regulator, iwi and hapū, NGOs and researchers. Each group has specific, and often conflicting, priorities which they centre their initiatives around. However, there are some shared drivers for the various efforts, including:
- Filling data and knowledge gaps, capitalising on opportunities to collect better data, and improving trust in data through improved verification and validation.
- Understanding the impacts of fishing on target species, non-target species and the broader ecosystem so that efforts can be focused on reducing harm.
- Using what we already know about the negative impacts of fishing, e.g. on habitat destruction, to improve practices.
Here we focus on current initiatives underway by various groups and how these might be better coordinated to support a more cohesive and integrated approach to fisheries management. We highlight the recent or upcoming regulatory changes by Fisheries New Zealand, various initiatives that have been taken by industry, examples of initiatives in the marine space that iwi have taken which impact fisheries management, and outline the funding and research settings relating to fisheries and the marine environment. More detailed analyses of specific research projects and innovation solutions are covered in ‘A future focus’.


Juliet learns about research that is undertaken on the NIWA vessel RV Tangaroa.
Regulator initiatives and data transformation
In 2015 Fisheries New Zealand undertook a Fisheries Management System review, and from this review they developed a major work programme to enhance and update the fisheries system. This programme, called the Fisheries Change Programme, is currently underway.
The Fisheries Change Programme aims to:
- Strengthen and make more modern the way we manage our fisheries.
- Ensure the sustainability of Aotearoa New Zealand’s fisheries.
The process of making these changes also highlights the difficulties in reaching consensus decisions in a shared space where the scientific evidence available is limited or has higher uncertainty.
The programme has three parts:
- Electronic catch and position reporting. Introducing mandatory electronic catch and position reporting to improve the collection and reliability of fisheries information.
- On-board cameras. Improving monitoring and verification capabilities, including the use of on-board cameras, to better observe fishing practice.
- Fishing rules. Changing fishing rules and policies to make them simpler, fairer and more responsive, while also incentivising better fishing practices.
These are at different stages of implementation and may evolve as the Ministry’s consultation progresses. The Fisheries Change Programme is a key piece of work towards integrating biodiversity into Aotearoa New Zealand’s fisheries management system and meeting our objectives under the CBD.[105, 106]
The process of making these changes also highlights the difficulties in reaching consensus decisions in a shared space where the scientific evidence available is limited or has higher uncertainty, particularly given the many different and competing interested in the marine space. For example, conservation of taonga species as a key objective may support a more precautionary approach, while enabling sustainable single species stock use has a different balance of considerations.
Other work that is being undertaken that is of importance to fisheries management, includes:
- MPA reform – the Government has signalled an intent to reform MPA legislation (Ministry for the Environment, Department of Conservation, Ministry for Primary Industries).
- Te Mana o te Taiao – Aotearoa New Zealand Biodiversity Strategy 2020 (Department of Conservation).
These initiatives are resource constrained and need to be integrated within other efforts across government in the marine environment.
Electronic catch and position reporting is live
Since 2019, all commercial fishers have been required to report catch electronically. There are some exemptions from ER, but cost is not a reason for exemption. There are now more than 1,000 vessels tracked in Aotearoa New Zealand through the electronic catch and position reporting system, which allows Fisheries New Zealand staff to track vessels in real time. In 2017 there were over 1,500 commercial fishing vessels registered in Aotearoa New Zealand.
These improvements in digital monitoring enable:
- More timely and accurate data.
- Verification of when and where fishing occurs.
A key focus of this activity is on gathering data for compliance purposes. There is potential to expand to use the data for more environmental and commercial purposes (as discussed in the section ‘Computers, cameras and AI could revolutionise catch monitoring’). With the drastically increased frequency of reporting there are significant opportunities to enhance the use of fisheries catch data and increase transparency in fishing practices. This in turn will enable faster response in fisheries management practice in response to change.
A key focus of this activity is on gathering data for compliance purposes. There is potential to expand to use the data for more environmental and commercial purposes.
The position reporting shows where fishing has taken place as the speed and direction of a vessel provide information on when a fishing event occurred, and whether this was in an area where that type of fishing is allowed. This observation is independent of fisher reporting (though the type of fishing/gear used is reliant on fisher reporting). In circumstances where this real-time information is being monitored, this allows for compliance action (such as meeting the vessel at port to verify catch in person). There is also the possibility for discarded catch to be traced back to the vessel if it was released from in some circumstances. There have already been significant advances in the detection of illegal activity and consequent prosecution.[107] This represents a radical change in the compliance landscape and the regulator is considering the appropriateness of the current offences and penalties within this new context (see consultation in 2019).

Electronic catch and position reporting. Image credit: Fisheries New Zealand.
On-board cameras are being introduced
One key way Fisheries New Zealand monitors fishers’ behaviour is through the use of observers. Observers will join a vessel for the duration of one or several voyages and record catch data.[108] Observer coverage varies from year to year and is low in some fisheries, particularly inshore fisheries where it may not be feasible to safely carry observers on smaller vessels. In deepwater fisheries the planned coverage ranges from 15-40% for most fisheries, and up to 90-100% in squid and southern blue whiting fisheries to monitor potential New Zealand sea lion bycatch.[109] Observer coverage is resource intensive and a significant increase in observer coverage would likely not be feasible.
There are differences in observed and unobserved behaviour when it comes to discarding and recording – the so-called ‘observer effect’.
However, digital monitoring is expected to substantively change how fisheries are monitored in Aotearoa New Zealand. Cameras can supplement observer monitoring by providing an alternative method of independent oversight (particularly when combined with electronic catch and position reporting).
The primary purpose of cameras is to verify fisher reporting, which can facilitate use of that data to enumerate catch and protected species interactions. Key benefits Fisheries New Zealand hopes to achieve over time with the initiative include:
- Improved verification of commercial catch and impacts of fishing on protected species. This could have benefits for meeting market expectations for transparency and verified supply chains.
- Improved environmental performance (species and habitats) through this increased monitoring.[110]
- Improved resilience by increasing the agility and responsiveness of industry through improved real-time information.
While the regulations have been in place since 2018, they do not yet apply to the majority of commercial fishing vessels.
Observers will still be required to collect biological data (such as fish otoliths), which cannot be captured with cameras. Fisheries New Zealand has introduced regulations for on-board cameras for commercial fishing vessels. While the regulations have been in place since 2018, they do not yet apply to the majority of commercial fishing vessels. The date for the regulation to apply more widely has been delayed several times. Most recently, the Minister of Fisheries has announced $40 to $60 million of funding to aid implementation of the initiative with a goal of 345 cameras to be installed by 2024. The approach to wider roll out would prioritise cameras on vessels in high-risk areas in the first tranche (e.g. habitats of Hector’s dolphins, Antipodean and Gibson’s albatross, black petrels, and hoiho/yellow-eyed penguins[111]). The second tranche would include lower risk areas where the protected species are still significant (e.g. New Zealand fur seals, common dolphins, flesh-footed shearwaters and Salvin’s albatross).
The regulations currently only apply to select vessels in a limited fishing area on the west coast of the North Island where endangered Māui dolphins are found (20 vessels). The industry has also initiated and trialled cameras in the Snapper 1 (SNA1) fishery. However, there have been several camera trials in New Zealand including set net vessels off the east coast of the South Island, bottom trawl vessels targeting snapper off the northeast coast of the North Island (Snapper 1 programme), and bottom longline vessels targeting snapper and bluenose/matiri[112] off the northeast coast of the North Island (the black petrel programme).
Policy changes are underway
Innovative trawl technologies
In 2017, the Ministry for Primary Industries made changes to regulations for commercial trawlers to allow for trial and innovation in trawling techniques.[113] Trawling regulations contain prescriptive requirements on use and configuration of trawl nets, so the amendment allowed for approval of other innovation if evidence shows it performs at least as well as existing nets. So far the use of ‘Precision Seafood Harvesting Modular System Trawl Net’ has been approved for deepwater fisheries (May 2018) and North Island fisheries (April 2019) which has tested the regulatory system and highlighted how processes might be improved (see case study: Precision Seafood Harvesting – Tiaki) notes some of the barriers to innovation that prescriptive regulations can have to innovation when they are predicated on existing technologies. There is a lot to be learnt from the experience of approving the Precision Seafood Harvester, with a key lesson that a permissive environment is required for gear innovation.
There is a lot to be learnt from the experience of approving the Precision Seafood Harvester, with a key lesson that a permissive environment is required for gear innovation.
These issues informed our recommendations in Themes 4 and 7.
Landings and discards
Most commercial fish are caught using bulk harvesting methods often resulting in many different species being caught together, while the QMS provides catch entitlements to fishers for individual species. This means fishers often catch species they are not targeting, resulting in unwanted fish. This is one of the fundamental challenges of fisheries management.
One size does not fit all as there is huge variation in the amount of bycatch according to the species targeted and the method. Pāua fishing is close to 100% selective (see case study: Pāua fisheries and industry-led management), whereas scampi trawling is not very selective at all. While improvements in fishing practices are reducing the amount of unwanted fish being caught, there is scope for significant improvement (and resulting reduction in wastage and a higher value catch). Fisheries New Zealand consulted on proposals to improve the management of Aotearoa New Zealand’s fisheries to ensure more efficient and sustainable commercial fishing in 2019. The consultation document noted that the current rules that set out what commercial fish must be landed and returned are complex, open to interpretation, difficult to comply with and monitor, and do not set adequate incentives. Proposed changes focus on simplifying and tightening the commercial rules relating to what fish is landed and what fish can, or must, be returned to the sea and aligning incentives to innovate to achieve best value from our fisheries.
Catch limit adjustments
There is work underway to allow more efficient adjustments to catch limits by streamlining and updating the decision-making processes. Currently Fisheries New Zealand has the capacity to adjust catch limits for around 30 to 40 stocks each year.[114] Other changes that require changes to regulation can take far longer. In 2019, catch limits were adjusted for 29 stocks. Where fish stocks are well understood, quicker responsiveness is important to respond to fish stock fluctuations and support sustainable fishing.
Consultation was undertaken in 2019 proposing that harvest control rules be used to adjust catch limits, with benefits of greater responsiveness, certainty, and transparency. Harvest control rules are pre-agreed responses to a change in the health of a fish stock. When harvest control rules are in place they can also be more difficult to deviate from (for instance, if there is a lot of annual fluctuation in stock biomass) so they work best for more stable stocks that have robust and regular stock assessments. Management procedures (pre-agreed rules in response to monitoring from the fishery) have been used for many years as a key mechanism for responsive adjustments of catch limits in some fisheries, e.g. some rock lobster stocks.
Quicker responsiveness is important to respond to fish stock fluctuations and support sustainable fishing.
Data transformation strategy
Fisheries New Zealand collects and stores vast amounts of data related to fisheries and the marine environment. Better utilisation of this existing data – through alignment and integration of datasets – will strengthen fisheries management decision-making processes.
Fisheries New Zealand is in the process of implementing a data transformation strategy, building its capability and maximising benefits from the increased volume and diversity of fisheries data arising from new initiatives.
Beyond Fisheries New Zealand, there is a wealth of data related to the marine environment collected by other groups. Data from non-fisheries sources is crucial to provide independent validation of stock and ecosystem health – which is a key component of shifting towards EAFM.
However, historical data management methods have created a highly fragmented landscape that is resistant to integration.[115] The disparate nature of marine science related databases in Aotearoa New Zealand is a problem as it prohibits full utilisation of data to inform fisheries management and research. Successfully using information from a variety of sources requires a strategic approach and data standards. Stats NZ could be approached to support this work.
This section outlines who collects data on fisheries and the marine environment in Aotearoa New Zealand (not including Fisheries New Zealand), including a selection of existing databases. It describes issues of data storage, integration and accessibility that impede effective and powerful use of data collected.
This discussion underpins recommendations in Theme 5.
Who collects data?
Central government agencies
Beyond Fisheries New Zealand, other government agencies hold data related to fisheries and the marine environment. This could be better integrated with the data captured and used by Fisheries New Zealand. Examples include the Department of Conservation, the Ministry for the Environment, and LINZ (the Marine GIS is of particular relevance). Multi-way sharing of this data between agencies would be mutually beneficial for different reporting requirements.
Industry
The seafood industry collects large amounts of data to inform their fishing practices, but this doesn’t necessarily get used by fisheries managers to inform decisions. A prime example is seafloor mapping data. The fishing sector has undertaken seafloor mapping across much of Aotearoa New Zealand’s territorial sea and EEZ to better understand the environments where they are fishing. This data could be collated and used as the basis to inform the needs of future mapping efforts to fill gaps (see ‘Habitat’ section). There are important privacy and anonymisation concerns, particularly around commercially sensitive information, that need to be worked through with industry. There is also work underway at FishServe to map out how existing modules within current and new electronic reporting systems could be integrated (see figure below). Improving the culture of the sector and facilitating data sharing, aggregation and analysis offers huge advances through integration.
Research institutes
Research undertaken at universities and research institutes, and the knowledge housed within these places, may be relevant to fisheries management decisions. However, it is not always designed to feed into the decision-making process, as the motivations for the studies are not necessarily directly aligned with fisheries management needs, or the format required for the data to be useful to the regulator is not clear to researchers. In particular, there are lost opportunities to incorporate a wide range of research into stock assessments rather than just research commissioned for those assessments. Some research is known about but is not incorporated into decision making – fisheries managers could actively seek to include this data in the decision-making process.
Changing institutional and decision-making processes to enable data and evidence from these institutions to be incorporated into the assessed evidence would be a significant start in filling data and knowledge gaps but would also represent a significant culture shift in some institutions. Incorporating wider research on ecosystems and the environment will also be crucial to support the transition towards EAFM. Researchers proactively sharing relevant data and research with the regulator would assist these efforts and there needs to be a willingness on the part of the managers to access, uptake and work from this type of information.
Local and regional councils
Councils collect data to inform their coastal plans and marine spatial planning, including data on habitats (see ‘Habitat’ section). Two-way sharing of data between councils and Fisheries New Zealand would benefit both local and central management of the marine environment. For example, the Marlborough District Council has habitat maps from collaborative mapping of ecologically significant areas and multibeam surveys.
Other groups
NGOs, community groups, recreational fishers, museums and others may collect and own relevant data that could feed into a marine science database.
Fragmented data collection and storage
When data is held in multiple databases there are lost opportunities for combining and overlaying different datasets to identify patterns and trends. The boxes below illustrate the fragmented nature of marine data in Aotearoa New Zealand, displaying a selection of the hundreds of databases that exist.
As explained above, there are many players in the marine data space, meaning that the best available knowledge on a particular issue is not necessarily held by the regulator. The more connected the research community is, the more different knowledge can be shared and considered in decision making.
Well-developed networks can overcome fragmentation in the research community, and allow more proactive, flexible and collaborative approaches.
Establishing and maintaining these connections can be achieved through multi-stakeholder and interagency networks. Well-developed networks can overcome fragmentation in the research community, and allow more proactive, flexible and collaborative approaches. Formalising collaboration can help to carve out a space for working through tensions around priorities and pace of work (see case study: Managing land-based impacts through a multi-sector marine spatial plan and case study: The Hawke’s Bay Marine and Coastal Group took a collaborative approach to prioritise research needs for the region).
Information sharing requires a strong focus on privacy and guidelines around the release of data, but with this in place, data from a range of sources could be made more accessible to improve transparency and build trust.
MPI and FNZ
E.g. National Aquatic Biodiversity Information System.
MPI Geospatial Portal (Launched 2020), public access to data relating to the commercial fishing regulations. Coordinates FMAs, general statistical areas, QMAs, commercial fishing regulations (including closed seamount areas and Precision Seafood Harvesting 71(a) approvals), BPAs, fishery notices (including temporary closures that are not S186 closures), marine reserves Type 1, marine mammal sanctuary (one area closed for set netting), ministerial decisions, submarine cables and pipeline protection zones.
Various databases managed by NIWA.
FishServe
Commercial Fisheries Service (owned by Seafood NZ) – provides commercial fishing industry support and maintains registers required under the Fisheries Act 1996 (e.g. quota ownership, ACE ownership, vessel register).
LINZ
Regional councils
e.g. Greater Wellington Regional Council, Hawke’s Bay Regional Council national marine data inventory, web portals.
Stats NZ
Data on a variety of marine indicators that underpin the environmental reporting series, including sea-level rise, marine economy, ocean acidification etc. See the Stats NZ website.
MfE
Web portal, data service that host marine data commissioned or gathered for Environmental Reporting (and other datasets such as the MEC).
DOC
Marine geospatial data available via Department of Conservation geoportal. Have facilitated use of SeaSketch as a data collation, display and spatial planning tool.
NIWA
Coastal and marine data portal (has non-fisheries marine data but also fisheries acoustic transects), NZ ocean data network (has non-fisheries marine data), and maintains the marine biosecurity data portal on behalf of MPI. NIWA-managed databases on behalf of Fisheries New Zealand that include data on trawls, acoustic, age, tag and conductivity, temperature and depth research databases, NIWA Centralised Observer Database (catch calculations and amounts for all species caught, details of fishing operations such as start and finish times, positions, fishing and bottom depths, devices and practices to protect non-targeted species, catch data for each tow or set).
Accessibility of datasets
While datasets held by Fisheries New Zealand are very valuable, there are calls to improve accessibility, which would facilitate greater analysis of this data.[4, 12, 116]
While data access is not an issue for those directly involved in the regulatory process of fisheries management, this is not always the case for others, such as industry and researchers.
For example, commercial fisheries provide data to regulators. This data includes information on catch, bycatch, and location. However, once with the regulator this data is not automatically available to those who provided it. This means they lose the ability to run their own analytics to inform their management in timely manner.
Official Information Act (OIA) requests are sometimes needed to access data held by Fisheries New Zealand. This process does not foster trust or collaboration. From a user perspective it is slow and awkward, while from a government perspective it is time and resource intensive. Fisheries New Zealand commonly relies on email, webposting and data extraction and manual analysis to respond to questions or OIA requests. In many cases Fisheries New Zealand does not itself store the data, so responding to requests is difficult.[12] There are some examples of external parties having established data sharing agreements.[117]
Some databases are accessible through Dragonfly, i.e. for seabird, marine mammal and turtle bycatch and some other research. There is also limited data sharing through data.govt.nz and the Ministry for Primary Industries Open Data Portal.
Accessibility of datasets is further complicated by the fragmentation of data storage (discussed above), as well as the need to manage the sensitivity-levels of an extensive and complex range of data. Metadata on the data collection, processing and storage systems is diffuse. The regulator has principles for release of information, though these will likely need updating as the form of data changes as new technologies are used.

FishServe schematic of how current and new data systems could be integrated in Aotearoa New Zealand’s fisheries management system to create a connected digital ecosystem. Click image to enlarge.
Te Mana o te Taiao – Aotearoa New Zealand Biodiversity Strategy 2020
Te Mana o te Taiao – Aotearoa New Zealand Biodiversity Strategy Strategy 2020, sets out how Aotearoa New Zealand can expand and build on the strong foundation the country has already built, to “allow our natural world, and the people in it, to thrive”.
The strategy includes an objective to ensure that natural resources are managed sustainably, which includes a number of specific goals that are directly related to fisheries. Some of these are included in the table below, and form a valuable foundation for developing a strategic action plan for the ocean.
This features in recommendations in Theme 2 and 6.
Tiaki me te whakahaumanu/protecting and restoring: Objective 12. Natural resources are managed sustainably.
| 2025 goals | 2030 goals | 2050 goals |
|---|---|---|
| 12.1.1 Environmental limits for the sustainable use of resources from marine ecosystems have been agreed on and are being implemented. | 12.1.2 Marine fisheries are being managed within sustainable limits using an ecosystem-based approach. | 2.1.3 Marine fisheries resources are abundant, resilient and managed sustainably to preserve ecosystem integrity. |
| 12.2.1 The number of fishing-related deaths of protected marine species is decreasing towards zero for all species. | 12.2.2 The direct effects of fishing do not threaten protected marine species populations or their recovery. | 12.2.3 The mortality of non-target species from marine fisheries has been reduced to zero. |
| 12.3.1 Environmental limits for the sustainable use of resources from freshwater ecosystems have been agreed on, and plans for the active management of fisheries have been developed with Treaty partners, whānau, hapū, iwi, Māori organisations and stakeholders. | 12.3.2 Freshwater fisheries are being managed sustainably to ensure the health and integrity of freshwater species and ecosystems while retaining cultural and recreational values, including for valued introduced species. | 2.3.3 Freshwater fisheries are not negatively affecting high priority biodiversity areas and threatened ecosystems and are under ongoing management in other places to maintain functioning ecosystems and cultural and recreational values, including for valued introduced species. |
| 12.4.1 The potential for different sectors to contribute to improved Indigenous biodiversity is understood, and sustainable use practices that include benefits for Indigenous biodiversity are becoming more widespread. | 12.4.2 Sustainable use practices that include benefits for Indigenous biodiversity are standard practice for biodiversity resource users (including tourism and recreation) and primary industry (including agriculture, forestry, fisheries, aquaculture and horticulture). | 2.4.3 Sustainable use practices are providing benefits for Indigenous biodiversity and maintaining ongoing economic and wellbeing benefits for people. |
Industry initiatives
Some initiatives that Aotearoa New Zealand’s fishing industry has taken to move towards fishing more sustainably are below. Innovations are discussed in more detail in ‘A future focus: Science, technology and innovation’.
- Changing how fisheries are managed without regulatory changes. There are examples of times industry has proactively made a management change ahead of being directed to so by the regulator. For example:
- Industry voluntarily lowered catch for certain species or stocks such as pāua,[118] and have worked closely with the regulator on fisheries plans outlined in the case study: Pāua fisheries and industry-led management.
- Fine-scale catch reporting in advance of regulatory requirements (e.g. CRA logbook programmes, PAU electronic data loggers, finfish catch spreading reporting).
- Enhancement and translocation (PAU).
- Area closures e.g. to protect spawning fish (e.g. PAU, finfish).
- Increasing minimum harvest size (e.g. PAU).
- Development and implementation of harvest control rules (CRA rules).
- Gaining certification from sustainability schemes. Sustainability schemes offer a way to benchmark fishing practices for a particular fishery against established standards,[119] resulting in accreditation or certification once met (discussed further in the section ‘Sustainability schemes provide a way to benchmark and improve fishing practices’). Aotearoa New Zealand’s fishing industry engages with a number of schemes, including the MSC, Friend of the Sea, Ocean Wise, and Monterey Bay Aquarium Seafood Watch, as well as Sea Choice which works to improve the various labels. Aotearoa New Zealand has been a world leader in meeting MSC standards, with hoki becoming the first whitefish fishery to be certified in 2001 (though this is contentious, see case study: The Marine Stewardship Council). Since then, eight species, which account for over half of the volume of Aotearoa New Zealand’s wild-caught seafood, have been certified to the MSC Fishery Standard. This includes nearly three-quarters of deepwater fisheries.
- Making fishing gear more sustainable. Aotearoa New Zealand’s fishing industry developed the Gear Innovations Pathway to drive innovation in this area (see case study: Gear innovation pathway). There are several examples of industry partnering with researchers or driving innovation in gear technology themselves, some supported by this scheme, that are covered in the section ‘How we fish’.
Eight species, which account for over half of the volume of Aotearoa New Zealand’s wild-caught seafood, have been certified to the MSC Fishery Standard. This includes nearly three-quarters of deep-water fisheries.

Skipjack tuna (Katsuwonus pelamis) is one of eight fisheries with MSC certification in Aotearoa New Zealand. Image credit: krw130lm/Wikimedia (CC BY-SA 3.0).

Iwi initiatives
Iwi and hapū have comprehensive mātauranga about their local marine environment, a responsibility to manage the oceans as kaitiaki, and a significant stake in the commercial fishing sector. Some iwi-owned commercial fishing companies are involved in the initiatives outlined above in ‘Industry initiatives’. There are a number of additional ways that iwi and hapū drive change and strive for improvement in the marine space. Here we highlight some initiatives that are underway to illustrate the breadth of this involvement, noting this list is not exhaustive.
Marine management
As discussed in the ‘Te ao Māori’ section, Māori have a range of approaches for marine management. Examples of initiatives that iwi have taken to manage or protect their rohe moana include:
- Ngāti Konohi established the Te Tapuwae o Rongokako Marine Reserve in 1999 in partnership with the Department of Conservation, following 10 years of discussions. The reserve is adjacent to a mātaitai reserve.
- Hapū of Motiti were involved in the efforts that led to the Motiti Protection Areas via the Motiti Rohe Moana Trust (discussed in detail in this case study).
- Te Tau Ihu Iwi Fisheries Forum help iwi develop plans that identify the customary, commercial, recreational and environmental objectives for fisheries of importance to that iwi.
Multi-stakeholder groups and planning processes
Several iwi and hapū have been key members in collaborative processes that have sought to improve the conditions of their rohe moana. Some examples are covered in the case studies as follows:
- Ngāti Kahungunu, Ngāti Kere and Ngāti Pāhauwere were part of the Hawke’s Bay Marine and Coastal group Research Roadmap process (profiled in this case study).
- Iwi of Hauraki and Tāmaki Makaurau were part of the Sea Change – Tai Timu Tai Pari (Hauraki Gulf Marine Spatial Plan, described in this case study).
- Te Rūnanga o Ngāi Tahu are part of Te Korowai o te tai ō Marokura in Kaikōura, representing its community and business interests (described in this case study).
Research
A number of iwi are involved in research projects in the marine environment that impact upon fisheries, drawing on mātauranga, and in some cases integrating this knowledge system with western science.
- Ngāti Kuri have partnered with Tāmaki Paenga Hira Auckland Museum, the University of Auckland, Massey University, NIWA and Manaaki Whenua on a five-year research programme starting in 2020 working on holistic approach to transform ecosystem wellbeing, Te mana o Rangitāhua.
- Whakatōhea are involved in the Moana Project which aims to better understand ocean dynamics (profiled in this case study).
- Te Ahu o Rehua: A Network for Cross Cultural Ocean Knowledge.
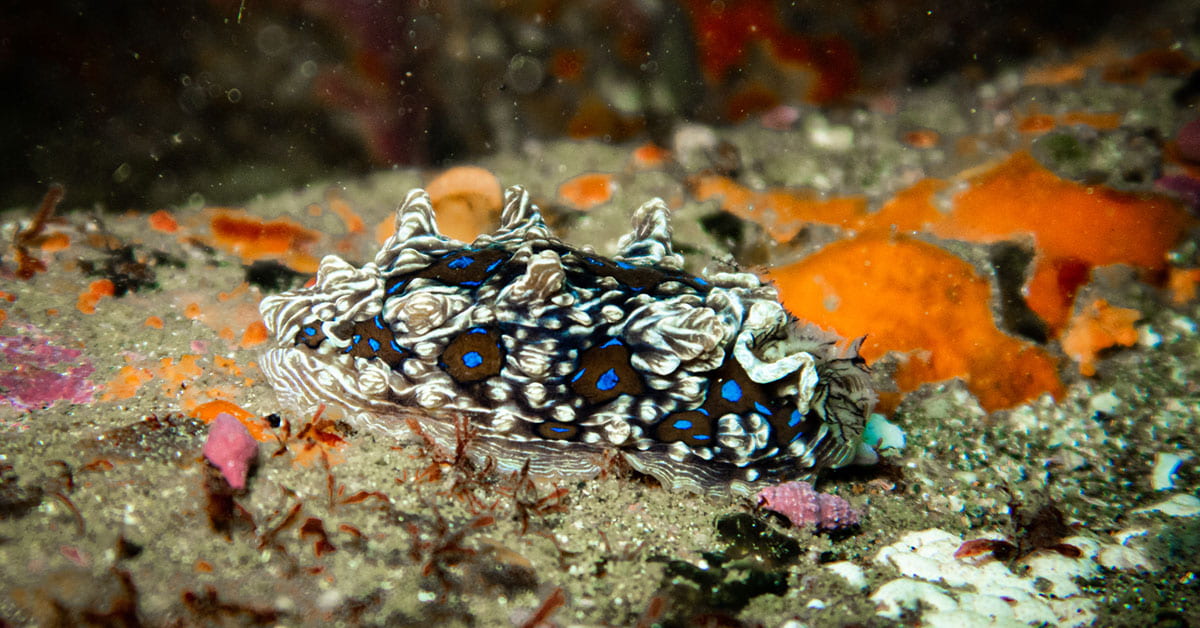
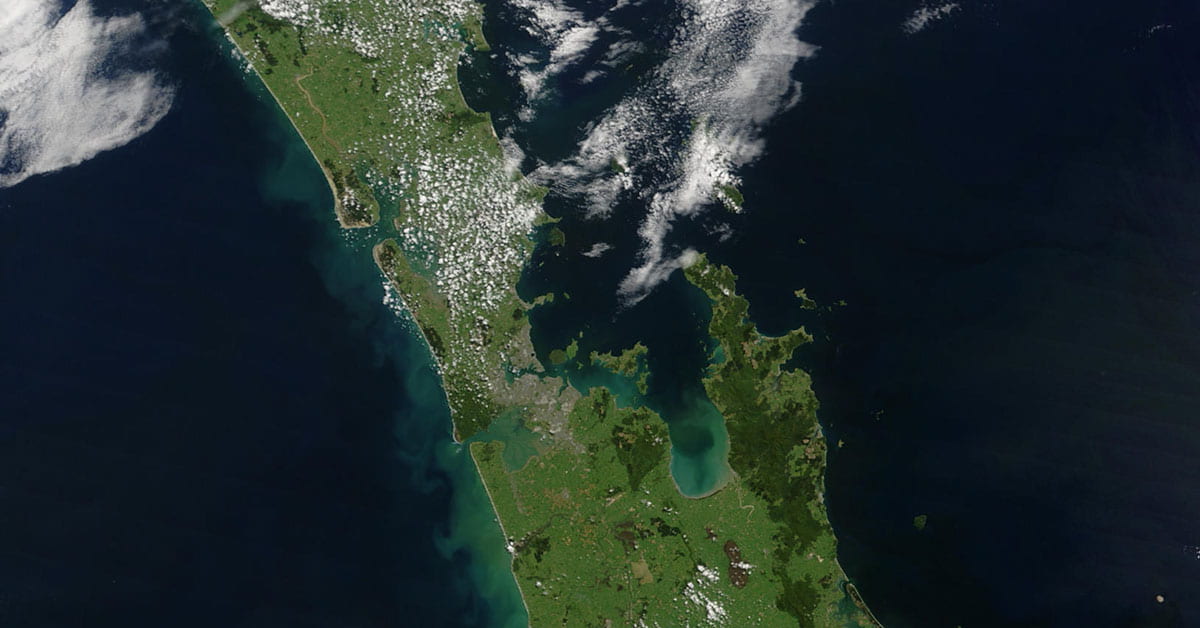
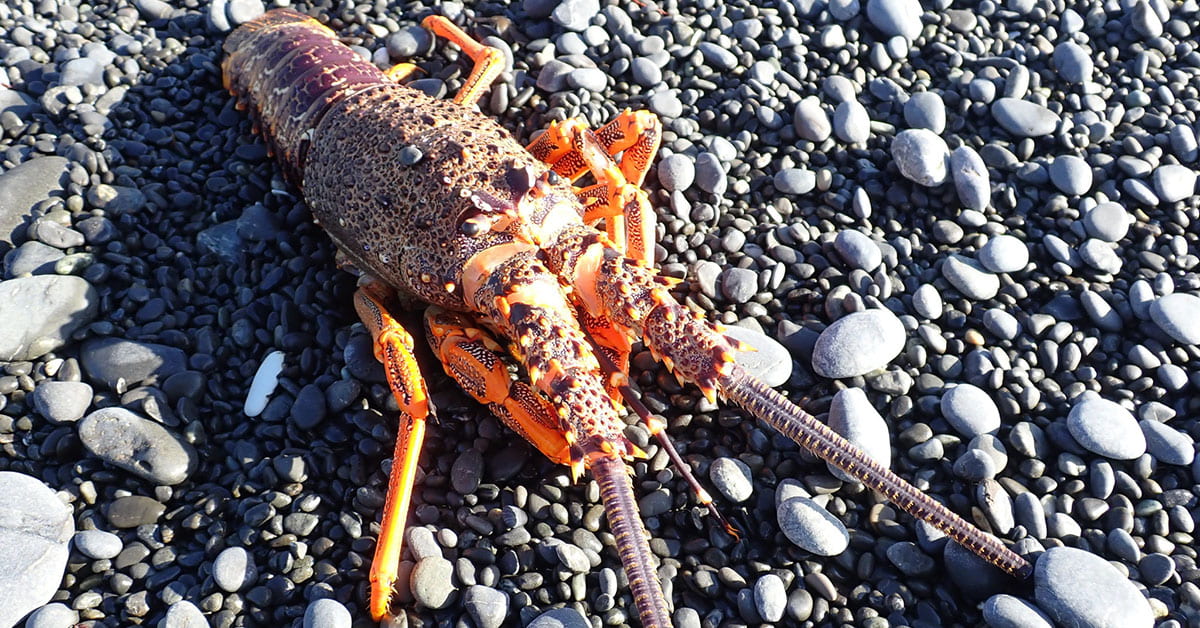
Research programmes, funding and prioritisation
Aotearoa New Zealand has an active research community in the areas of fisheries and the broader marine environment. Research programmes range from government monitoring to multi-year collaborative national science challenges through to clinical trials for pharmaceutical products from fish by-products. There are many active researchers and research projects delivering within a cluttered landscape of institutional structures and funding schemes. The pathway to impact is not aided by the complexity of the research landscape.
Fisheries and marine research is undertaken for a range of different reasons. The research on fisheries in Aotearoa New Zealand spans areas such as:
- Operational research to inform fisheries management.
- Innovative and translational research to improve processes.
- Basic research to understand the biology of our fisheries.
- Conservation approaches for species and habitats.
Biodiversity and ecosystem function research tends to be studied outside of fisheries research.
The pathway to impact is not aided by the complexity of the research landscape.

The range of groups involved in Aotearoa New Zealand’s fisheries and marine research. Click image to enlarge.
Funding opportunities for these different areas of research tend to remain separate (see table below). The majority of research undertaken by Fisheries New Zealand is focused on supporting stock assessments of high-value commercial species, partly funded through industry levies to cost recover research. Projects that are important to fisheries management but not directly related to high commercial value fisheries, such as research to understand species biology, ecosystem impacts or species protection, are less likely to be funded through current fisheries-specific funding mechanisms and in many cases have to rely on general contestable research funds, which sometimes do not view such strategic research as appropriate for their fund. Some projects are otherwise reliant on research undertaken or commissioned by other agencies’ levied funding (such as the Department of Conservation’s Conservation Services Programme). This has meant that gaps in knowledge for many species remain.
The majority of research undertaken by Fisheries New Zealand is focused on research that supports stock assessments of high-value commercial species funded through industry levies to cost recover research.
Since 1994, Fisheries New Zealand has recovered costs from the commercial fishing sector for a range of activities, e.g. monitoring and managing commercial fisheries, including fisheries research; observer, registry, and conservation services; and compliance.[120] Cost recovery is a regulated requirement and reflects that quota owners are either beneficiaries of the research services, i.e. the science underpins their quota levels, or their activities exacerbate risk, i.e. we need to undertake this research because of the risks caused by fishing. Over the last few years, around 60% of Fisheries New Zealand’s research budget has been cost-recovered.[117] Though cost recovery aims to recover cost for research for all commercially exploited stocks,[121] it does not currently achieve this. A consequence of how the cost recovery system functions is that limited, high-value species have been prioritised for scientific research. Concerns that the research agenda would be dominated by industry voices were raised prior to implementation[120] and remain.
Between 2017 and 2020, Fisheries New Zealand spent on average $22 million per year on fisheries research, with approximately 80% spent specifically on research to determine the health of fish stocks and sustainable catch levels.[117] Research into the effects of fishing on the marine environment and biodiversity research expenditure has grown from near zero in 1999 to around 20% of the current budget. This has occurred as the need for research to address key unknowns or uncertainties important to fisheries management were realised, e.g. population sizes of commonly caught seabirds. However, there remains a need for much more research to fill data and knowledge gaps in these areas.
There have been efforts to develop a research strategy – such as the National Marine Research Strategy – which is being drafted by the Ministry for Primary Industries on behalf of the Natural Resources Sector. The National Marine Research Strategy “has a shared vision of the marine research required in Aotearoa New Zealand over the next 20 years to guide and inform the development of Aotearoa New Zealand’s marine economy, safeguard the marine environment for future generations, and co-ordinate marine research effort across the country as we increasingly look to the sea for food, energy, minerals, and other resources.”
This feeds into our recommendations in Theme 7.
Research and innovation could go in many different directions, but limited funding and resources mean that prioritising and allocating funding to the most pressing issues is important. Within a low-trust sector with multiple competing interests, these priorities are highly contested. The ocean sector would benefit from coordinating research that improves environmental or sustainability outcomes and fills critical knowledge gaps about species, with research that promises short-term economic benefits, when prioritising scarce funding.
Limited funding and resources mean that prioritising and allocating funding to the most pressing issues is important. Within a low-trust sector with multiple competing interests these priorities are highly contested.
There have been successful funding initiatives where government and industry have come together to fund innovative projects on a large scale (see case study: Precision Seafood Harvesting – Tiaki). Success has also been achieved on a smaller scale, through Seafood Innovations Ltd (SIL). The research partnership, established under the Ministry of Business, Employment and Innovations’ now discontinued partnership funding scheme, is owned by Seafood New Zealand and Plant & Food Research. SIL’s mission is to:
- Promote industry-initiated research and development projects primarily aimed at:
- Increasing the value of existing harvests,
- Reducing harvesting and processing costs, and
- Enhancing consumer-driven product attributes.
- Be responsive to the dynamic nature of the seafood industry and adapt its research and development resources to such changes, provided that all seafood industry sectors shall remain eligible for research project funding at all times.
The partnership offers support to companies to develop proposals for funding, and has particular interest in novel ideas and projects with a higher degree of risk (and correspondingly higher potential reward). This is key to inspiring and nurturing real innovation in the industry. Funding is up to 50% of the contribution made by the company or project sponsor. A number of projects supported by SIL are highlighted throughout this report. There has reportedly been a massive jump in industry-initiated and sustainability-focused SIL projects in the last two to three years.[122] However, there is currently no further funding going towards this partnership, with only current projects continuing until development. The programme is seen as particularly valuable to an industry that operates in such a high-cost research environment.
Research institutes also have significant work programmes underway (see case study: Sustainable Seas/Ko ngā moana whakauka). There is an opportunity to strengthen the relationship between these groups and expand funding opportunities for collaboration so that researchers can be more in tune to the needs and goals of fisheries management and help to fuel innovation and productivity through their research. An example of a collaborative project that demonstrates an academic-industry partnership in fisheries is outlined in the case study of potting as an alternative to bottom trawling on a small scale (see case study).
The need for a strategic approach to science prioritisation and collection underpins recommendations in Theme 7.
Summary of key research funds in Aotearoa New Zealand that may fund fisheries or marine research.
| Fund | Agency | Amount/info | Notes |
|---|---|---|---|
| Sustainable Food and Fibre Futures programme (SFFF) | MPI | $40 million/year across whole primary sector offering grants of up to $100,000 or large partnership projects of more than $5 million. | SFFF aims to deliver long-term environmental, social, economic and cultural outcomes. |
| Primary Growth Partnership (PGP, replaced by the SFFF but some projects still underway) | MPI | Varies – e.g. for Precision Seafood Harvesting – Tiaki project the PGP matched Industry funding of $24 million (see case study). | Not fisheries-specific – for whole primary sector Prioritises potential economic benefits to NZ. |
| Strategic Science Investment Fund (SSIF) – Marine Environment Platform | MBIE | $16.9 million per year for the marine environment platform (NIWA); a portion of Plant & Food Research’s $42.7 million investment goes towards seafood research; $2 million per year to Cawthron’s seafood safety platform. | SSIF not fisheries-specific but has dedicated funding to marine research. |
| Customary Fisheries Research Fund | MPI/FNZ | $180,000/year. | Targeted to support fisheries research to help Māori to manage their customary fisheries. |
| Fisheries Science Research | MPI/FNZ | ~$22 million. | Funded by the Crown or through industry levies. |
| Seafood Innovations Ltd | Seafood NZ, Plant & Food Research, MBIE | Suggest budgets in range of $50,000 to $500,000 per annum. Funds up to 50% of project. | Not accepting proposals for funding at this time (check website for updates). Further details below. |
| Sustainable Seas National Science Challenge | MBIE | Up to $71.1 million over 10 years (since 2014). Includes innovation fund ($2 million for 2020). | See case study: Sustainable Seas/Ko ngā moana whakauka. |
| Gear Innovation Pathway | FINZ/SIL | No co-funding required. | See case study: Gear Innovation Pathway. |
| Non-fisheries-specific contestable research funds (e.g. Marsden, Endeavour) | MBIE/Royal Society Te Apārangi | Not fisheries-specific. | |
| Conservation Services Programme | Department of Conservation | ~$2 million in 2019/2020. | Monitors impact of commercial fishing on protected species, studies species populations and looks at ways to mitigate bycatch. |
| EnviroLink | MBIE/Regional councils | $1.6 million annually. | Funds research organisations to provide regional councils with advice and support on environmental topics. |
We need a plan for our oceans
Our ocean will benefit greatly from a shared plan, refined regulatory tools and a permissive research environment. As discussed in the section ‘Data and knowledge gaps’, there are many stressors on our marine ecosystems and these complex problems require multifaceted and informed management responses. Here we reflect on some of the key issues and highlight avenues for improved processes and outcomes. While beyond the scope of science advice per se, this discussion informs our overarching recommendations on the system changes that are required to enable science to make a difference.
While beyond the scope of science advice per se, this discussion informs our overarching recommendations on the system changes that are required to enable science to make a difference.
Cohesive oversight of all marine activities is required to facilitate the necessary multi-party conversations, improve the culture, and build trust.
We need a shared vision and goals for the ocean
Our specific recommendations can make a difference in the short term. However, a long-term approach is needed to ensure the health of our ocean endures. Collectively agreeing on shared aspirations and agreeing a path to reach these shared goals will be critical to achieve this. The large and diverse range of stakeholders from central and local government, iwi, large commercial fishing companies, smaller companies or independent fishers, recreational fishers, community groups and researchers all have a role to play (see figure).[123]
Even within central government, there are a range of relevant agencies who regulate the marine environment (see appendix 6).[124] Different stakeholders have divergent and often conflicting priorities. Cohesive oversight of all marine activities is required to facilitate the necessary multi-party conversations, improve the culture, and build trust.
This underpins Theme 1 of the recommendations.
An overarching strategy is needed
The complexity of the regulation and management of fisheries, and the variable implementation of management plans, has led to some people having limited trust in the regulatory system – although key decisions are made publicly.[125, 126] A clear, overarching and transparent strategic action plan would be beneficial to guide long-term planning and action in the marine domain, making the environmental bottom line clear and setting our aspirations for the marine environment. The need to provide certainty to tangata whenua and other stakeholders around fisheries management was recognised as important during the development of the Fisheries 2030 Strategy released in 2009 and is still referred to occasionally (e.g. it is mentioned in AEBAR 2020), but does not appear to be widely referenced (e.g. not referred in recent fisheries plans and consultations) and is not readily available through the Fisheries New Zealand website.[127, 128] The 2009 Fisheries 2030 Strategy followed a number of previous attempts to establish an Oceans Policy in Aotearoa New Zealand which began some useful thinking (see appendix 11).
As part of Fisheries 2030, fisheries plans are described as an integral component of the wider strategic context. They are key for increasing transparency and putting into action longer-term strategy. Fisheries plans are provided under section 11(a) of the Fisheries Act 1996 (and are approved by the Minister) and can apply to a stock, multiple stocks, fishing years, or areas, or any combination of these. The provision gives flexibility for the regulator to provide a rapid and highly customised response to emerging issues. However, there appears to have been a lack of consistent use and update of fisheries plans. For example, the deepwater and middle-depth fisheries plan from 2010 was to provide an overarching framework for management of deepwater fisheries for a five-year period,[129] though was not formally updated until 2019. In the inshore fisheries, a plan was developed in 2011 and reportedly trialled but never finalised (i.e. never approved by the Minister). Consultation on a new inshore fisheries plan was underway in 2020, but does not include shellfish. The extent to which finalised (or un-finalised) fisheries plans actually inform fisheries management and are implemented is unclear, particularly in a medium-to-long term view. This erodes trust.
… there appears to have been a lack of consistent use and update of fisheries plans.
A clear integrative framework to coordinate and implement more specific localised plans would better enable stakeholders to develop and implement their own fisheries plans (subject to approval by the Minister). While development and approval of a fisheries plan has been achieved by the pāua industry (see case study: Pāua fisheries and industry-led management), the processes to enable future initiatives could be streamlined.[130]
More integration and oversight would also enable a conversation to harmonise definitions across stakeholders and legislation. For example, there is currently no agreed definition of sustainability.
… there is currently no agreed definition of sustainability.
Our legislative environment has advantages in providing multiple tools that can be used in management (e.g. from taiāpure at a local level to national regulatory changes) which is critical to manage a complex biological system at the appropriate management scale. However, overarching policy to drive how and when these tools are used might reduce future conflict. The recent Te Mana o te Taiao – Aotearoa New Zealand Biodiversity Strategy 2020 provides an example of a national strategy, developed through local collaborative process led by the Department of Conservation.
In the Aotearoa New Zealand context, the basis for what an overarching strategy or plan for the oceans would look like has already been developed through legislation and policy statements, including the RMA, EEZ Act, Marine and Coastal Area (Takutai Moana) Act 2011, New Zealand Coastal Policy Statement, Te Mana o Te Taiao – Aotearoa New Zealand Biodiversity Strategy 2020, and the Ministry of the Environment’s environmental goals published in 2015.[131] Future work could build on these foundations.
A key limitation of taking a collaborative, multi-stakeholder approach to region-specific management is that progress can be slow, despite action sometimes being urgent. However, there are many provisions with the current Fisheries Act 1996 that could be better used to enact immediate change, in parallel with the broader conversation (see ‘We can build on the QMS to improve sustainability’).
The recent Te Mana o te Taiao – Aotearoa New Zealand Biodiversity Strategy 2020 provides an example of a national strategy, developed through local collaborative process led by the Department of Conservation.
Overall, a strategic action plan that provides a clear framework for annual reporting, decision making, future planning and lead agency responsibility could be used to coordinate all efforts in this space and guide collaborative, localised plans. This could improve the clarity, transparency and future focus of Aotearoa New Zealand’s fisheries management system.
This discussion underpins Themes 1, 2 and 3 of the recommendations.
Refining our management tools and increasing transparency
Globally, there has been a widespread decline in the populations of fish we catch that has largely been driven by fishing[52] (see discussion above in ‘Known impacts of fishing on the sustainability of target stocks’). Research indicates that fisheries recovery would ultimately increase fisheries biomass, profits and food security.[132] From data on stocks that are scientifically assessed in Aotearoa New Zealand, stock levels have generally trended up since the 1980s (though there are exceptions by individual stock). Inshore fisheries had been heavily depleted in the decades preceding introduction of the QMS in 1986, so the baseline from which improvements have been made is an important contextual factor. Estimates of original biomass will always be contested, but new scientific techniques may enable more refined estimates.
Providing accessible information around the assumptions made and knowledge gaps during decision making may drive the necessary research to enable better informed stock assessments to ensure stocks are being fished at a sustainable level.
During this project, we heard calls for increased transparency around the stock assessment process and how decisions are made. Given the limited data for a significant number of fished stocks, and the lack of assessment for even more, it is crucial that how allowable catch is decided is clear. Providing accessible information around the assumptions made and knowledge gaps during decision making may drive the necessary research to enable better informed stock assessments, to ensure stocks are being fished at a sustainable level. Detail on this process is discussed further in the sections ‘Data and knowledge gaps’, and ‘Regulator initiatives and data transformation’.
Regulations and management decisions can also play a role in facilitating innovation and bringing good ideas to the fore so that they can be implemented as best practice across the industry. High-level clarity around regulatory direction will provide reassurance to industry.[133]
In Aotearoa New Zealand, the plenary reports summarise the information held and used in stock assessments.[14, 73–75] However, as reported in Our Marine Environment 2019, half of our stocks have too little information to be scientifically assessed. These are mostly minor fished species, but represent around one third of the catch volume in 2019. In addition to this, there are almost 300 ‘nominal’ stocks that are not evaluated (see figures above). While many of these stocks are ‘nominal’ as they are not generally found in a given QMA, others may be nominal due to low economic value or commercial potential. These stocks may still have high ecological importance, in which case impacts of overfishing these species could be highly significant (including to customary and recreational fishing). The magnitude of this issue is not clear from the data available but warrants further attention. At a high level, it is clear from these figures that there are significant improvements that could be made to increase the proportion of stocks that are scientifically assessed.
… half of our stocks have too little information to be scientifically assessed. These are mostly minor fished species, but represent around one third of the catch volume in 2019.
Despite the challenges, there are many opportunities to increase data, synthesise what we know, improve knowledge that could strengthen more reliable assessment of stocks, and make these assessments and their uncertainties more widely accessible. There is a wealth of data for both single-species assessment and ecosystem monitoring that could be more routinely used for stock assessment. Reportedly, useful data that could be used in stock assessments is not accessed because it sits outside of the formal research system that feeds into these assessments. While researchers who sit outside of the formal system are reportedly frequently invited to Science Working Group meetings and may also present at these, there seems to be a disconnect in how inclusive participants perceive this process to be.
… there are many opportunities to increase data, synthesise what we know, improve knowledge that could strengthen more reliable assessment of stocks, and make these assessments and their uncertainties more widely accessible.
Data that may not feed into stock assessments includes research on fisheries impacts on benthic food webs,[134] the role of fishers in the spread of disease in fisheries,[135] catchability and abundance,[136] and how overfishing has led to major ecological shifts in coastal ecosystems.[137, 138] Data on observations of non-Indigenous species is held in tertiary institutes, as well as other technological institutes, regional councils, and other research organisations.[139] This data is valuable at a national management level, so a system that allowed it to be shared between organisations would add value (see section ‘Data-driven knowledge is the cornerstone of effective and sustainable fisheries management’). When considering data held by regional councils there are also issues of scale in terms of the data (given they are generally confined to smaller boundaries than used in the QMS).
There can be disagreement between conclusions reached by the regulator compared to research undertaken by other researchers, given the data available to each differs (as demonstrated in the case study ‘Mixed messages: Are we overfishing our rock lobsters?‘). With different methods, models and assumptions used, and high uncertainties, estimates will differ. Where the regulator has less information about a stock or species, consideration of fisheries-independent research would be particularly valuable.
Fisheries New Zealand acknowledges this is an issue and is working to make information more accessible (e.g. by including summary tables at the end and start of chapters of the comprehensive Fisheries Assessment Plenary documents and the AEBAR reports and developing webpages) but this work in in its early stages.[140]
With different methods, models and assumptions used, and high uncertainties, estimates will differ. Where the regulator has less information about a stock or species, consideration of fisheries-independent research would be particularly valuable.
This underpins Themes 4 and 5 of the recommendations.
Moving towards an EAFM
As discussed in the section ‘We can build on the QMS to improve sustainability’, the current fisheries management regime has mechanisms that can enable an ecosystem approach and some aspects have already been incorporated.
This view is also reflected in a report commissioned by Seafood New Zealand which explores whether our legislation enables an EAFM (see appendix 6).[1] The research found that “there are no situations in which the Act does not require or enable a management approach that is consistent with the identified principles of EAFM” – in other words, there is nothing in the Act that prevents a shift towards EAFM (see appendix 1: EAFM principles and relevant Fisheries Act 1996 provisions).
The report also notes that “the existence of legislative provisions that require or enable EAFM does not indicate the extent to which our fisheries management processes, policies and decisions reflect EAFM in practice – either generically or on a fishery by fishery basis”. Much could be achieved in the short term by implementing the provisions already in the Act. See the case study ‘Pāua fisheries and industry-led management’ for an example of an ecosystem approach that is already being applied.
“The existence of legislative provisions that require or enable EAFM does not indicate the extent to which our fisheries management processes, policies and decisions reflect EAFM in practice – either generically or on a fishery by fishery basis”.
Much could be achieved in the short term by implementing the provisions already in the Act.
There are many opportunities to increase our use of EAFM within the confines of the Fisheries Act 1996. For example, the operationalisation of HPSFM, research prioritisation (as discussed below), the need for ecological indicators (see ‘Ecological monitoring’ section), alignment with overarching strategy (as discussed above), and through implementation of other recommendations and considerations as described in some detail in the Fathom report.[1] Ultimately, an EAFM must focus on objectives, not only on the use of specific tools, and can be accelerated within the confines of the current legal frameworks. Several sections of the Act could be applied in addition to Section 9(c): for example, Section 9 more widely covers environmental principles, section 11 covers sustainability measures, and Section 15 covers fishing-related mortality of marine mammals and other wildlife.
An EAFM can be accelerated within the confines of Fisheries Act.
This underpins recommendations in Theme 6.
Better integration and collaboration is needed to get the most out of our research investment
Science could be used much more efficiently to address the challenges facing our oceans and fisheries within a more integrated system. Aligning research objectives more closely with the needs of industry and fisheries managers is an important step in this improved use of science, and could be established during the process of developing a shared plan.
Science could be much more efficiently used to address the challenges of the oceans within a more integrated system.
A more integrated approach to research and innovation in the marine domain is needed to fill existing knowledge gaps and enable innovation to thrive, which in turn will support more sustainable fishing. Stronger relationships between research programmes across disciplines, the regulator, and industry would enable strategic priorities to be more clearly identified to support both fisheries management and conservation goals. It is also important that people outside the research sector, including fishers, have clear pathways to bring their significant knowledge, experience and ideas to address the complex challenges faced in the marine environment.
It is also important that people outside the research sector, including fishers, have clear pathways to bring their significant knowledge, experience and ideas to address the complex challenges faced in the marine environment.
Better facilitation of interactions between fishers, particularly those from smaller companies with local knowledge of the ecosystems in which they fish, and organisations undertaking research and development, will ground ideas in local contexts. For example, many questions about the basic biology of commercial species remain unanswered, and yet would strengthen an EAFM.
An overarching Oceans Strategic Action Plan would provide a framework in which to prioritise knowledge gaps to be filled and new technology to be pursued when updating research plans. Currently, most fisheries research services are generally negotiated as annual. This approach does not necessarily incentivise long-term investment by research providers to invest in assets and staff. Clarity on what is funded by the industry and what is funded by government would enable more constructive relationships between different aspects of the marine research sector. Clear prioritisation of research questions to be answered, and technology to be explored, can both inform and be informed by an Oceans Strategic Action Plan.
This underpins Theme 2 and 7 of the recommendations.
References and footnotes
[1] Fathom (2019) EAFM and the Fisheries Act 1996.
[2] Resource Management Act 1991, section 6.
[3] Primary Production Committee (1996) Fisheries Bill: Commentary.
[4] The Nature Conservancy (2017) Learning from New Zealand’s 30 years of experience managing fisheries under a Quota Management System.
[5] LegaSea and New Zealand Sport Fishing (2020) Rescue Fish – Ika Rauora, A pathway to fish abundance and marine ecosystem recovery.
[6] TAC also explicitly allows for other sources of fishing-related mortality (such as mortality related to burst nets).
[7] This excludes nominal stocks.
[8] Section 11 “Sustainability Measures” of the Fisheries Act 1996.
[9] Ministry of Fisheries (2008) Harvest strategy standard for New Zealand Fisheries, p. 30.
[10] See Terms of Reference for Fisheries Assessment Working Groups (FAWGs) in 2020 and Membership and Protocols for all Science Working Groups in 2020.
[11] Hoplostethus atlanticus.
[12] Ministry for the Environment and Stats NZ (2019) New Zealand’s Environmental Reporting Series: Our Marine Environment 2019.
[13] Nominal stocks represent less than 1% of catch.
[14] Fisheries New Zealand (2019) Status of New Zealand’s fish stocks 2019.
[15] Te Ohu Kaimoana (2019) Te Ohu Kaimoana’s response to Fisheries New Zealand’s “Your fisheries your say” consultation.
[16] Telesetsky, A. (2016) Fishing for the future: Addressing fisheries discards and increasing export value for New Zealand’s sustainable fisheries.
[17] Mace, P. M. et al. (2014) The evolution of New Zealand’s fisheries science and management systems under ITQs, ICES Journal of Marine Science, 71(2), pp. 204–215.
[18] Anderson, O. F. et al. (2019) Non-target fish and invertebrate catch and discards in New Zealand hoki, hake, ling, silver warehou, and white warehou trawl fisheries from 1990-91 to 2016-17. New Zealand Aquatic Environment and Biodiversity Report No. 220.
[19] Durante, L. M. et al. (2020) Shifting trophic architecture of marine fisheries in New Zealand: Implications for guiding effective ecosystem-based management, Fish and Fisheries, pp. 1–18.
[20] Peart, R. (2018) Voices from the Sea: Managing New Zealand’s fisheries, Environmental Defence Society.
[21] Surf clam is a generic term referring to seven species: deepwater tuatua (Paphies donacina), fine dosinia (Dosinia subrosea), frilled venus shell/puukauri (Bassina yatei), large trough shell (Mactra murchisoni), ringed dosinia/tuangi-haruru (Dosinia anus), triangle shell (Spisula aequilatera), trough shell (Mactra discors).
[22] Aldrichetta forsteri.
[23] Dunn, A. et al. (2000) Calculation and interpretation of catch-per-unit-effort (CPUE) indices. New Zealand Fisheries Assessment Report 2000/1.
[24] Harley, S. J. et al. (2001) Is catch-per-unit-effort proportional to abundance?, Canadian Journal of Fisheries and Aquatic Sciences, 58(9), pp. 1760–1772.
[25] Input from Industry.
[26] Eigaard, O. R. et al. (2014) Technological development and fisheries management, Reviews in Fisheries Science and Aquaculture, 22(2), pp. 156–174.
[27] Roa-Ureta, R. H. (2012) Modelling in-season pulses of recruitment and hyperstability-hyperdepletion in the Loligo gahi fishery around the Falkland Islands with generalized depletion models, ICES Journal of Marine Science, 69(8), pp. 1403–1415.
[28] Abraham, E. and Neubauer, P. (2015) Relationship between small-scale catch-per-unit-effort and abundance in New Zealand abalone (pāua, Haliotis iris) fisheries. Peer J Preprint.
[29] Merluccius australis.
[30] Finucci, B. (2019) Descriptive analysis and a catch-per-unit-effort (CPUE) analysis of the West Coast South Island (HAK 7) fishery for hake (Merluccius australis), New Zealand Fisheries Assessment Report 2019/55.
[31] Langley, A. D. (2017) Catch-Per-Unit-Effort indices for snapper in SNA 8, New Zealand Fisheries Assessment Report 2017/45.
[32] Input from Fisheries New Zealand.
[33] Dunn, M. R. (2006) A review of experimental methods for determining catchability for trawl surveys, New Zealand Fisheries Assessment Report 2006/51.
[34] Kahui, V. and Armstrong, C. (2012) Search and destroy: A bioeconomic analysis of orange roughy fisheries on seamounts in New Zealand, University of Otago Economics Discussion Papers, 1201.
[35] Thunnus obesus.
[36] Pinkerton, M. H. (2018) Impacts of climate change on New Zealand fisheries and aquaculture, in Climate Change Impacts on Fisheries and Aquaculture: A Global Analysis, pp. 91–119.
[37] Townhill, B. L. et al. (2019) Marine recreational fishing and the implications of climate change, Fish and Fisheries, 20(5), pp. 977–992.
[38] Schofield, M. I. et al. (2018) Catch-per-unit-effort (CPUE) analyses for SNA 2, New Zealand Fisheries Assessment Report 2018/15, pp. 87.
[39] Tuck, I. D. (2020) Characterisation and CPUE standardisation of scampi in SCI 4A, New Zealand Fisheries Assessment Report 2020/04.
[40] Finucci, B. et al. (2019) Diversity, abundance, behaviour, and catchability of fishes from trap catch and underwater video in the Arabian Gulf, Fisheries Research, 220, p. 105342.
[41] Ministry for Primary Industries (2011) Draft national fisheries plan for inshore finfish, p. 47.
[42] Thunnus maccoyii.
[43] Xiphias gladius.
[44] Lampridae species.
[45] Thunnus alalunga.
[46] Chelidonichthys kumu.
[47] Pseudocaranx georgianus.
[48] Williams, J. et al. (2017) The economic contribution of commercial fishing to the New Zealand economy, Business and Economic Research limited (BERL), p. 55.
[49] Note that some of the stocks are further divided into substocks.
[50] Hilborn, R. et al. (2019) Effective fisheries management instrumental in improving fish stock status, Proceedings of the National Academy of Sciences of the United States of America, 117(4), pp. 2218–2224.
[51] See reporting here compared to here.
[52] Palomares, M. L. D. et al. (2020) Fishery biomass trends of exploited fish populations in marine ecoregions, climatic zones and ocean basins, Estuarine, Coastal and Shelf Science, 243. P. 106897.
Note there is contention around the methods used, see earlier debate in Pauly, D. et al. (2013) Does catch reflect abundance?, Nature, 494, pp. 3–6.
[53] Hilborn, R. (2012) Overfishing: What everyone needs to know, Oxford University Press.
[54] Pinsky, M. L. et al. (2011) Unexpected patterns of fisheries collapse in the world’s oceans, Proceedings of the National Academy of Sciences of the United States of America, 108(20), pp. 8317–8322.
[55] Bradley, D. and Gaines, S. D. (2014) Counting the cost of overfishing on sharks and rays, eLife Sciences Publications, 3, pp. 1–3.
[56] Froese, R. and Kesner-Reyes, K. (2002) Impact of fishing on the abundance of marine species, ICES Council Meeting Report CM, pp. 1–12.
[57] McCauley, D. J. et al. (2015) Marine defaunation: Animal loss in the global ocean, Science, 347(6219), pp. 247-255.
[58] Le Pape, O. et al. (2017) Overfishing causes frequent fish population collapses but rare extinctions, Proceedings of the National Academy of Sciences of the United States of America, 114(31), p. E6274.
[59] Hauge, K. et al. (2007) Fisheries Depletion and Collapse, International Risk Governance Council Chemin de Balexert, 9(1219), 21, pp. 1–21.
[60] Lake, R. et al. (2017) Adapting to climate change: Information for New Zealand food safety systems, pp. 1–135. A project for the Ministry for Primary Industries sustainable land management and climate change fund.
[61] Jackson, J. B. C. et al. (2001) Historical overfishing and the recent collapse of coastal ecosystems, Science, 293(5530), pp. 629–637.
[62] MacDiarmid, A. B. et al. (2013) Rock lobster biology and ecology: Contributions to understanding through the Leigh Marine Laboratory 1962-2012, New Zealand Journal of Marine and Freshwater Research, 47(3), pp. 313–333.
[63] Input from NIWA.
[64] Genypterus blacodes.
[65] Simmons, G. et al. (2016) Reconstruction of marine fisheries catches for New Zealand (1950-2010). Institute for the Oceans and Fisheries, Working paper series, Working paper 2015-87.
[66] For example, incentives to misreport where ACE is difficult to acquire, fishing in one area but reporting in an area where quota or ACE is located, misreporting of species identity to avoid counting against particular quota or ACE. Note that the reference [65] is contested.
[67] Hersoug, B. (2018) After all these years – New Zealand’s quota management system at the crossroads, Marine Policy, 92, pp. 101–110.
[68] Fisheries New Zealand (2018) Blue Cod National Strategy, p. 24.
[69] Dunn, M and Langley, A. (2018) A review of the hoki stock assessment in 2018. New Zealand Fisheries Assessment Report 2018/42.
[70] Fisheries New Zealand (2019) Review of sustainability measures for 2018, part Hoki (HOK1) for 2019/20, Fisheries New Zealand Discussion Paper No: 2019/06, 1.
[71] Punt, A. E. (2019) Spatial stock assessment methods: A viewpoint on current issues and assumptions, Fisheries Research, 213, pp. 132–143.
[72] McKenzie, A. (2018) Assessment of hoki (Macruronus novaezelandiae) in 2017, New Zealand Fisheries Assessment Report 2018/40.
[73] Fisheries New Zealand (2019) Stock assessments and stock status volume 1: Introductory section and Alfonsino to Groper, Fisheries Assessment Plenary, Wellington, New Zealand.
[74] Fisheries New Zealand (2019) Stock assessments and stock status volume 2: Hake to Pilchard. Fisheries Assessment Plenary. Wellington, New Zealand.
[75] Fisheries New Zealand (2019) Stock assessments and stock status volume 3: Pipi to Yellow-eyed mullet. Fisheries Assessment Plenary. Wellington, New Zealand.
[76] Fisheries New Zealand (2020) The status of New Zealand’s Fisheries 2019.
[77] Fisheries New Zealand (2018) Aquatic environment and biodiversity annual review 2018: A summary of environmental interactions between the seafood sector and the aquatic environment.
[78] Ministry for Primary Industries (2020) Aquatic environment and biodiversity annual review 2019-20, p. 724.
[79] Scott, K. N. (2019) Maritime law enforcement in New Zealand, The Korean Journal of International and Comparative Law, 6(2), pp. 245–268.
[80] Input from MfE.
[81] Epigonus telescopus.
[82] Tracey, D. M. et al. (2017) Another New Zealand centenarian: Age validation of black cardinalfish (Epigonus telescopus) using lead-radium and bomb radiocarbon dating, Marine and Freshwater Research, 68(2), pp. 352-360.
[83] Fisheries New Zealand (2014) Black Cardinalfish (CDL). pp. 78-93.
[84] Input from FNZ: While the last assessment reported was in 2004, an assessment was attempted in 2020 based on an acoustic survey. A subsequent acoustic survey has also been undertaken. Both surveys found very few fish and the assessment gave unsatisfactory results but they did indicate that either the surveys didn’t manage to locate the fish or that the stocks has not recovered.
[85] Fisheries New Zealand (2009) Orange roughy West Coast South Island (ORH7B).
[86] Pawley, M. D. M. (2014) Population and biomass survey of pipi (Paphies australis) on Mair Bank, Whangarei Harbour, 2014.
[87] Ministry for Primary Industries (2014) Initial position paper on sustainability measures within PPI1A at Mair Bank and Marsden Bank (Whangarei).
[88] Fisheries New Zealand (2009) Scallops Nelson/Marlborough (SCA7).
[89] Ministry for Primary Industries (2017) Temporary closure of the Southern Scallop (SCA7) Fishery.
[90] It will be removed from the list of “below the hard limit” stocks at the next update in early 2021.
[91] MRAG Asia Pacific (2017) Seafood risk assessment: New Zealand Southern Bluefin Tuna Fishery.
[92] Thunnus orientalis.
[93] Fisheries New Zealand (2020) Annual review report for highly migratory species fisheries 2019/20. Fisheries New Zealand Technical Paper No: 2020/03.
[94] Fisheries New Zealand (2015) Pacific Bluefin Tuna (TOR).
[95] Western and Central Pacific Fisheries Commission (2019) Conservation and management measure for Pacific bluefin tuna.
[96] Pleuronectiformes.
[97] Tetrapturus audax.
[98] Zeus faber.
[99] Kathetostoma spp.
[100] Phillips, N. L. (2002) Descriptive and catch-per-unit-effort (CPUE) analyses for black cardinalfish (Epigonus telescopus) in QMA 1, New Zealand Fisheries Assessment Report 2002/55, p. 54.
[101] Dunn, M. R. (2009) Review and stock assessment of black cardinalfish (Epigonus telescopus) on the east coast North Island, New Zealand, New Zealand Fisheries Assessment Report, Wellington: NIWA.
[102] MacGibbon, D. J. (2016) The fishery for black cardinalfish: Characterisation and CPUE, New Zealand Fisheries Assessment Report 2016/66.
[103] Wallace, C. and Weeber, B. (2005) The devil and the deep sea – economics, institutions and incentives: The theory and the New Zealand quota management experience in the deep sea, in Deep Sea 2003: Conference on the governance and management of Deep-sea Fisheries, Queenstown, New Zealand, pp. 462–491.
[104] Ministry of Fisheries (2002) A description of the New Zealand fisheries for the two groper species, hapuku (Polyprion oxygeneios) and bass (Polyprion americanus), New Zealand Fisheries Assessment Report 2002/13.
[105] Hon Stuart Nash (2018) Environmental Defence Society (EDS) Conference.
[106] Department of Conservation (2019) New Zealand’s sixth national report to the United Nations Convention on biological diversity, Reporting period: 2014-2018.
[107] E.g. see reporting here, here and here.
[108] Observers’ role also includes protected species monitoring, fishery-independent catch monitoring, and biological sampling.
[109] Fisheries New Zealand (2020) Medium term research plan for Deepwater Fisheries, Fisheries New Zealand Information Paper No: 2020/01.
[110] The key purpose of monitoring is for compliance purposes, with indirect environmental benefit, rather than for the purpose of environmental monitoring.
[111] Megadyptes antipodes.
[112] Hyperoglyphe antarctica.
[113] Ministry for Primary Industries (2017) Fisheries (Innovative Trawl Technologies) Notice 2017, p. 13.
[114] 29 stock assessments were undertaken in the October 2020 round. See consultation documents.
[115] Brett, A. et al. (2020) Ocean data need a sea change to help navigate the warming world, Nature, 582(7811), pp. 181–183.
[116] The Sustainable Future Institute (2011) Evaluating the fisheries and aquaculture dataset, Sustainable future institute Working Paper 2011/6.
[117] Input from Fisheries New Zealand.
[118] PauaMAC7 (2019) Paua fisheries plan for PAU7, p. 12.
[119] This relies on an agreed definition of sustainability (and whether this applies to the environment or just a single stock).
[120] Harte, M. (2007) Funding commercial fisheries management: Lessons from New Zealand, Marine Policy, 31(4), pp. 379–389.
[121] Aranda, M. and Christensen, A. (2009) The New Zealand’s quota management system (QMS) and its complementary mechanisms, Comparative Evaluations of Innovative Fisheries Management, Springer, 19-41.
[122] Input from Seafood Innovations Ltd.
[123] Note that in the inshore fisheries, recreational fishers also represent a significant stakeholder. Recreational fishing is out of scope of this report but should be acknowledged as another challenge in developing a shared vision and goals.
[124] Some government organisations do already work together through the Marine Hub (a policy development and advice group).
[125] Lundquist, C. J. et al. (2016) Science and societal partnerships to address cumulative impacts, Frontiers in Marine Science, 3, pp. 1–12.
[126] For example, see The Decision letter – Minister of Fisheries and Review of Sustainability Measures for selected stocks for 1 October 2020: Final advice paper.
[127] See report by PricewaterhouseCoopers and Ministy of Fisheries branded report.
[128] See Te Ohu Kaimoana comment that Fisheries 2030 seems to have been discarded.
[129] Ministry of Fisheries (2010) National Fisheries Plan for Deepwater and Middle-depth Fisheries, Part 1A, p. 59.
[130] Te Ohu Kaimoana (2020) Te Ohu Kaimoana post-election briefing.
[131] Scott, K. N. (2016) The evolution of marine spatial planning in New Zealand: Past, Present and Possible Future, International Journal of Marine and Coastal Law, 31(4). 652-689.
[132] Costello, C. et al. (2016) Global fishery prospects under contrasting management regimes, Proceedings of the National Academy of Sciences of the United States of America, 113(18), pp. 5125–5129.
[133] McClurg, T. (2002) Foundations for effective marine ecosystem management, International Institute of Fisheries Economics and Trade (IIFET) Conference, Wellington, New Zealand, pp. 1–14.
[134] van der Reis, A. L. et al. (2018) Preliminary analysis of New Zealand scampi (Metanephrops challengeri) diet using metabarcoding, PeerJ, 2018(9), pp. 1–25.
[135] Zha, H. (2018) Aspects of the biology of tail fan necrosis in spiny lobster. A thesis submitted for the degree of Doctor of Philosophy in Marine Science, The University of Auckland, Auckland, New Zealand.
[136] Kane, P. L. (2015) Investigating the catchability of the New Zealand rock lobster (Jasus edwardsii), with aspects to fisheries ecology. A thesis submitted for the degree of Master of Science in Marine Science, The University of Auckland, Auckland, New Zealand.
[137] Shears, N. and Babcock, R. (2003) Continuing trophic cascade effects after 25 years of no-take marine reserve protection, Marine Ecology Progress Series, 246, pp. 1–16.
[138] Shears, N. and Thomas, H. L. (2014) Marine reserves in New Zealand: Ecological responses to protection and network design, Cambridge: Cambridge University Press, pp. 600–623.
[139] Seaward, K. and Inglis, G. (2018) Long-term indicators for non-indigenous species (NIS) in marine systems, NIWA Client Report No. 2018310CH, p. 31.
[140] Input from Fisheries New Zealand.