
To what extent can we quantify Aotearoa’s plastic? New Zealand’s data challenge
Measuring the amount and types of plastic we use and discard is a prerequisite for appropriate management and monitoring – it is a vital step in allowing us to make evidence-informed decisions around where we direct resources to improve our use and management of plastic, and to track their effectiveness. A baseline material flow analysis is essential to inform and prioritise policy changes and to hold us accountable by measuring improvements over time. We need to understand the scale of plastic use and the types of plastic that are most problematic to inform what changes to implement and their relative priorities. It is necessary not only to consider which plastics are used most often, but also how long the products are used for and whether appropriate end-of-life solutions are available.
There is currently no coordinated or standardised approach to measure or report plastic use and disposal by material type in Aotearoa New Zealand. As a result, there are large gaps in our understanding of the material flows of plastic through the country. Throughout our consultations with various stakeholders along the plastics value chain, the need for accurate and thorough data collection has been unanimously cited as a priority area. With the Ministry for the Environment and numerous businesses signing the New Plastics Economy Global Commitment, it is a critical time to initiate the collection of high-quality data on plastics so that we have a solid understanding of the baseline from which we must improve and to inform practical and meaningful decisions in the short-term.
Our analysis has identified how plastics flow through Aotearoa New Zealand, and where data are or should be captured. The data we report here were obtained from existing databases or published reports. Where data were not available or only partially representative of the national use of plastics, case studies were used. Given the variety of sources and methods, there were varying levels of confidence in the estimates. By collating currently accessible data on the amount and types of plastic used and discarded in Aotearoa New Zealand, we have highlighted major gaps in our understanding of plastic material flow through the country, underpinned by the lack of a framework to report plastic use and disposal by material type.
It is a critical time to initiate the collection of high-quality data on plastics so that we have a solid understanding of the baseline from which we must improve

Flows of plastic into and out of Aotearoa New Zealand, including leakage into the environment. Plastic leaking into the environment includes macro and microplastics, and affects land, marine and air environments. It also includes waste that is burned or buried in unregulated landfill. Sources of data are outlined in the table below.
Summary of what we know about the amount of plastic in Aotearoa New Zealand
| Tonnes/year | Confidence | Source (year) | Partial data | ||
|---|---|---|---|---|---|
| IMPORT | Raw resin and plastic material | 575 000 | High | Statistics NZ (2018)[1] | |
| Finished products or packaged goods | ? | ? | Synthetic textiles – 13,000 tonnes (read the case study 'How big is the plastic clothing problem for Aotearoa New Zealand?') | ||
| EXPORT | Raw resin and plastic material | 75 000 | High | Statistics NZ (2018) | |
| Finished products or packaged goods | ? | ? | |||
| Waste plastic | 35 000 | High | Statistics NZ (2018) | ||
| IN USE | Packaging | 150 000 | Medium | Packaging NZ (2015)[2] | Plastic drink bottles – 25 000 tonnes (read the case study 'Uncertainty around data on plastic beverage containers') |
| Construction | ? | ? | 350 m² residential development – 80 kg mixed plastic waste (read the case study 'Plastic waste during new-build construction') | ||
| Agriculture | ? | ? | Waikato and BOP rural properties – 5900 tonnes wraps, covers, films; 1500 tonnes containers, drums (read the case study 'Agricultural plastic waste') | ||
| Other | ? | ? | |||
| WASTE | Plastic collected for recycling | 45 000 | Medium | NRRT (2018)[3] | |
| Plastic waste landfilled | 380 000 | Medium | Eunomia (2015) and Perrot et al. (2018)[4] | ||
| Pre-consumer industrial waste | 4500 | Medium | Plastics NZ (2005)[5] | ||
| LEAKED INTO ENVIRONMENT | Marine litter | ? | ? | Sustainable Coastlines – average litter density of 411/1,000 m² [6] | |
| Land litter | ? | ? | Keep New Zealand Beautiful – average litter density 118/1,000 m² [7] |
Contents
- How much plastic do we import?
- What do we manufacture from imported plastic?
- How much plastic do we export?
- How much plastic is in use in Aotearoa New Zealand?
- How much and which types of plastic do we reuse onshore?
- How much plastic do we recycle and waste?
- Opportunities for capturing waste data
- How much plastic is leaking into the environment in Aotearoa New Zealand?
- Recommendations
- References
How much plastic do we import?
In Aotearoa New Zealand, plastic is imported as resin which is then manufactured into products and packaging, or imported as part of a finished product and/or packaging. To gain a complete understanding of the amount and types of plastic entering the country, we need to be able to capture metrics for both the resin and finished products.
Imports of raw resin and plastic products
Tonnages of imported plastic material
Currently, the weight (and $NZD value) of raw resin imports and some plastic products are captured under trade commodity 39, ‘Plastics and articles thereof’, within the Harmonised Trade System. The data are obtained from export and import entry documents lodged with the New Zealand Customs Service, and provided via Statistics NZ.
Imports have increased from around 400,000 to 575,000 tonnes in the past 10 years (see figure below), with an associated increase in value of $845 million. Of the amount imported, over half is identified as ‘in primary forms’ (including resins) and the remainder are products, many of which are used in manufacturing such as plates, sheets, film, foil and strip. Some other plastic products are captured in these imports, but it is not exhaustive. The total weight of imports in primary form have increased since 2009, but the proportion of resin versus other products has decreased from 63% in 2009 to 53% in 2019 (see Appendix 8 for detail).
In 2018, around 575,000 tonnes of plastic resin and products were imported to Aotearoa New Zealand

Plastic imports captured by ‘plastics and articles thereof’ by tonnes and $NZD for the past 10 years.
Types of plastic imported
The type of plastic that a product is made out of essentially dictates the best outcome for what happens at its end-of-life. Therefore, to invest in the right technology and infrastructure so that we can manage our own plastic waste onshore, we need to understand the proportion and amount of each type of plastic imported and ensure that the technology and infrastructure is flexible enough to deal with changes in plastic volumes and types. The breakdown of material types imported as raw resin can be used as a starting point, but because this does not capture the material type of all plastic imported as finished products or packaging, it is limited in its accuracy. In addition, raw resins may be combined with other resins or materials and this may limit end-of-life options for the products manufactured from these.
Import data for resin types 1-7 shows that LDPE (#4) is the most common type of plastic imported in raw resin form (see table below) (see Appendix 8 for details of specific trade codes included in this analysis). The proportions of each resin are roughly in line with global estimates for plastic use.
Breakdown of resin types 1-7 imported into Aotearoa New Zealand in 2018 in raw resin form
| Type | % of plastic in NZ | % from global estimates [8] |
|---|---|---|
| 1 (PET) | 7 | <10 |
| 2 (HDPE) | 26 | *with LDPE 36 |
| 3 (PVC) | 12 | 12 |
| 4 (LDPE) | 31 | * |
| 5 (PP) | 18 | 21 |
| 6 (PS) | 4 | <10 |
| 7 (other) | 3 | <10 |
Between 2009 and 2018, the volume of raw resin imported into Aotearoa New Zealand has fluctuated, particularly for HDPE (#2). There has been a steady increase in the tonnes of imported LDPE (#4), which is used for products such as soft plastic packaging and bale. The tonnes of imported PP (#5) has also increased – this type of plastic is recyclable but is often limited by the infrastructure to do so and also the ability of recyclers to separate it out as a sorted waste stream. There appears to be a sharp dropoff in the tonnes of PS (#6) imported. The reason for this is unknown and could be due to changes in trade coding or supplier exemption to report as the weight for expansible polystyrene dropped from over 10,000 tonnes to zero in one year.

Tonnes of raw resin (types 1-7) imported into Aotearoa New Zealand from 2009 to 2018.
Sources of imported plastics
Plastic resin and products captured by trade data under ‘Plastics and articles thereof’ are mainly imported from Asia, Australia and North America. The volumes of imports by economy do not distinguish between bio- and fossil-based plastics. Negligible amounts of bioplastic are manufactured onshore for research purposes, but not for production, and are ignored for the current snapshot. On the other hand, for imported finished products made of or containing plastics these data do not illustrate which countries are the biggest suppliers (excluding the few products captured by the trade data).

Proportion of resin and plastic product imports captured by trade data for 2018, by economy of origin.
Knowledge gaps
Plastics in finished products or packaged goods
Import data do not currently capture the volume of all plastic entering the country within finished products or packaged goods. Finished products may be completely or partly made of plastic, but these data are not necessarily captured within the categorisation ‘Plastics and articles thereof’. This is because a finished product is often not defined by what it is made from.
Examples of finished products that contain plastic but are not included under the category ‘Plastics and articles thereof’ in import data include toys, appliances, clothing and footwear, electronics, food and beverages (packaging), teabags, cars, tyres, cigarettes, building materials and medical products.
The total weight and types of plastic that are imported into Aotearoa New Zealand in finished products and/or associated packaging is unknown. Rough estimates could be made by calculating approximate quantities of plastic per product and multiplying this by the number of those products that are imported via Statistics NZ data. Further, secondary and tertiary plastic packaging is used throughout different stages of the supply chain and is also not captured in import data. An example of this is stretch film used to wrap pallets.
Hard to capture plastics
Even after considering both imported raw resin and finished products, we are likely to still be missing some plastic entering the country for two main reasons. Firstly, some products have ‘hidden’ plastics – it may not be obvious that there is plastic in the product at all. For example, an aluminium can of drink is actually lined with a plastic resin and the base ingredient of chewing gum is a type of plastic. However, hidden products are unlikely to account for a large proportion of plastic imported into Aotearoa New Zealand. Other data simply may not be captured, including consignments valued under $1,000, which will include individual products purchased online and received via international shipping and the packaging around imported products. Again, this is likely to be relatively small in volume although increasing with the popularity of internet shopping.
What do we manufacture from imported plastic?
We assume the amount of resin imported into Aotearoa New Zealand is manufactured into plastic products and/or packaging materials onshore. Understanding the material type, lifetime use and sector use of manufactured products is essential for informing decisions around managing plastic waste and directing efforts for redesign of products manufactured in Aotearoa New Zealand.
Plastics manufacturers have detailed data on their use of polymers and products produced and disposed. Previously, this information has been collected and aggregated by Plastics NZ via surveys, with the last survey completed in 2012. Based on the results of the 2012 survey, Plastics NZ estimated that over half of the imported resin was manufactured into packaging, with the remainder mainly used in construction and agriculture. Of the material manufactured into packaging, 60% was used for rigid packaging and the remaining 40% was used for flexible packaging.
For comparison, estimates for sector use of resin plastics calculated from data for Europe, the United States, China and India covering the period 2002–2014 are 44.8% packaging, 18.8% construction, 11.9% consumer and institutional products, 6.7% transportation, 3.8% electrical, 0.8% industrial machinery, and 13.2% other.[9]
Plastics NZ estimates of the proportion of imported resin used for manufacture by sector.
Around 60% of the resin imported into Aotearoa New Zealand is manufactured into packaging, which is dominated by single-use or short-lived products
The estimates made by Plastics NZ are derived from survey data which was then extrapolated based on import data from Statistics NZ. Plastics NZ stopped collecting mass balance surveys after 2012, due to limitations in data availability (reporting was voluntary and dropped off when the Packaging Accord finished in 2009) and concerns around accuracy of these data and the number of assumptions needing to be made to perform estimates.
As a result, there are no recent, accurate data on the products and packaging manufactured in Aotearoa New Zealand from imported resin.
Specifically, we lack clarity on:
- The amount of each polymer type used for manufacture, by sector
- Key product uses, by sector
- How long products are used for (short-term vs long-term).
Some companies are making the weight of plastic packaging they produce publicly available, as part of their participation in the New Plastics Economy Global Commitment. This includes some Aotearoa New Zealand owned and operated companies, such as Earthwise Group Ltd, who stated that they produce 284 tonnes of plastic packaging per year.
How much plastic do we export?
There are little data on how much plastic is exported from Aotearoa New Zealand. Data are collected on items identified as ‘Plastics and articles thereof’ but not on other products that may include plastic. Furthermore, Aotearoa New Zealand’s export industry relies heavily on plastic packaging. Examples of some of the exported products that may use plastic packaging include dairy, meat, fruit and vegetables, seafood and honey.
Detailed data on tonnage and $NZD value of exports is available from Customs New Zealand via Statistics NZ. As with imports, plastic resin and some products are captured under the harmonised trade code 39 ‘Plastics and articles thereof’ (see Appendix 10). Waste plastic exports are captured in these data but not included in this analysis. For articles captured in trade data, export tonnages have fluctuated between 2009 and 2018, with an overall increase from roughly 60,000 to 75,000 tonnes and an associated increase in value of $79 million.
Tonnage and $NZD value is available for all other exported products, including finished products and packaged goods that contain plastic, but the weight or type of plastic within these is not recorded. The same method used to estimate plastic use in imported finished products (read the case study ‘How big is the plastic clothing problem for Aotearoa New Zealand?’), could be used to estimate the amount of plastic exported in all exported products.

Plastic exports captured by ‘plastics and articles thereof’ by tonnes and $NZD for the past 10 years, excluding plastic waste.
How much plastic is in use in Aotearoa New Zealand?
Global estimates have considered the volumes of plastic ‘in use’ and how this differs by sector (see figure below). It is estimated that 30% of plastics ever produced are currently in use. Entering and leaving the ‘in use’ phase differs significantly by sector. In 2015, 146 million tonnes of plastic entering use were for packaging, and 141 million tonnes left the use phase, whereas 65 million tonnes entered use for construction and only 12 million tonnes left use. PVC (#3), a dominant material type used for pipes in construction, had over double the weight enter the use phase compared to the amount that left the use phase (38 vs 16 million tonnes).
Differences in product lifetime distributions for plastics in different sectors highlight that packaging has the biggest volume and shortest length of use. Product lifetime is plotted as log-normal probability distribution functions (PDF). Source: Geyer et al. 2017.
Understanding which types and how much plastic is in use, and when it is likely to leave the use phase, is important for waste management planning. We also need more information about the nature and quantity of plastic use in Aotearoa New Zealand in order to increase resource efficiency and appropriately reuse, refurbish, remanufacture, repair, recycle or dispose of plastic products in Aotearoa New Zealand’s economy.
Packaging mass balance estimates
The closest estimates to establishing the volume of plastic in use in Aotearoa New Zealand are the packaging mass balance results published as part of the Packaging Accord from 2004 to 2009,[10] and – in response to concerns about the methods used for the previous estimates – a follow-up estimate published in 2015 using a simplified methodology.
In 2008, the mass balance estimates were 136,491 tonnes of plastic packaging produced, 154,381 tonnes consumed, and 36,918 tonnes recovered. It is worth noting that there are significant limitations in this estimate because, due to the lack of consistent and verified data, many assumptions were made that may have introduced error. The estimates did not capture packaging material imported and relied on the goodwill of third party agencies providing accurate data. Methodological limitations of this approach are described in detail by Packaging New Zealand in their 2015 report.
The more simplified approach was used to estimate recovery rates for 2013 based on export waste and population/GDP data. Assuming all plastic waste was exported, the estimate relied on Statistics NZ export data. The limitation of this is that the method excludes the amount of plastic reused or recycled onshore, or going to landfill. Using this method, the weight of plastic packaging estimated to be recovered in Aotearoa New Zealand was 41,900 tonnes per year, equating to 9.4 kg per person. This method does not provide an estimate for production or consumption.
Estimates from 2008 suggest that around 150,000 tonnes of plastic packaging are consumed in Aotearoa New Zealand every year, which equates to 30 kg per person
These estimates highlight how the shortcomings in data currently limit our ability to understand the scale of plastic in use and the need to establish a uniform approach to measure the types and volumes of plastic being used in Aotearoa New Zealand. It may be possible to address the lack of consistent, aggregated data on the amount of plastic in use by utilising, repurposing or extending existing data frameworks. An example is provided in a case study ‘Capturing plastic packaging data through a supply chain database’, whereby information on the weight and material type of primary and secondary packaging is recorded through a supply chain database’s product catalogue.
Knowledge gaps
As can be seen from comments throughout this report, we have serious gaps in our knowledge of how plastic moves through Aotearoa New Zealand. We are limited in our understanding of the amount and types of plastic that are:
- In imported finished products and packaging
- Manufactured into products and packaging onshore (excluding those exported)
- Reused
- Collected as waste and sent to landfill or recycled.
How much and which types of plastic do we reuse onshore?
In order to reduce how much plastic we waste, it is favourable to reuse plastic products where appropriate. Reuse systems are important to combat the mountain of waste that comes from single-use plastic packaging for food and drinks, and can also be used in secondary and tertiary packaging along the supply chain such as for plastic pallets and crates. There are a few reuse systems that exist in Aotearoa New Zealand, but it is far from commonplace. It is even less common to measure the amount of plastic or other materials displaced by reuse systems. Globelet, a company who provide reusable cups at festivals, have estimated how many cups are displaced by their system (read the case study ‘A reusable system to replace single-use cups’). We need to track reuse systems in order to understand the amount of plastic waste diverted by their implementation.
Best practice
The WRAP UK provides a methodology and accompanying tool for quantifying the environmental and economic impacts of reuse.
The key characteristics of the methodology include guidance on:
- What to include and exclude in the analysis (i.e. system boundaries)
- Product lifetimes and displacement effects of reuse
- Allocation of environmental or economic impacts to different parts of the supply chain
- Use of costs and prices
- Jobs and labour costs.
Knowledge gaps
At present, we do not have comprehensive information on all reuse systems displacing single-use plastics that are currently in place in Aotearoa New Zealand, and as a result we lack information on the types and weight of plastic currently being diverted from use/waste due to these existing reuse systems.
We also do not know the key products that future reuse efforts should focus on (prioritised by quantity, volume, material type etc.) or the potential environmental and economic impacts of reuse systems for Aotearoa New Zealand.

How much plastic do we recycle and waste?
To quantify the amount of plastic that New Zealanders waste, we need to consider the volume sent overseas and the amount that is dealt with onshore. Waste data reported here do not include the amount of plastic that leaks into the environment, or waste that is dumped, buried or burned in non-regulated sites.
Currently in Aotearoa New Zealand, plastic waste is managed through recycling (the majority of which is sent offshore) and sending waste to landfill. Plastic is collected for recycling or landfill through multiple systems, including household kerbside collection, public space bins and drop-off points, and commercial collection. Waste data do not account for the amount of plastic that leaks into the environment.
No existing requirement for data collection
Currently, there are no statutory requirements under the WMA for councils to report waste data within a specific data framework or to report data externally. The WMA allows regulations to be developed under section 86 that could require a council to report on the expenditure of their waste levy money or, if set under section 49, on performance standards for the implementation of a WMMP. Under section 51 of the WMA, councils are required to prepare a Waste Management and Minimisation Plan (WMMP). Part of this is a waste assessment, for which data should be collected on waste quantities, projection of quantities, composition, source of waste, and destination of waste and diverted materials. The Ministry for the Environment encourages councils to find as much relevant data as possible for their assessment and aim to have their data capture methodology consistent with those of other councils but, ultimately, the level of data collection is determined by a council’s own circumstances, desired community outcomes, interest, and available resources.
Councils may also be limited in the data they can access if they contract out collection and recovery services to private operators due to how contracts are set up. Where private operators manage facilities and collection services under contract, some data may be obtained through key performance indicators in the contract they have with council or through bylaws. As the WMA only covers waste (and not recovered materials), bylaws can only be used to obtain data on plastic to landfill and not plastic for recycling.
Plastic collected for recycling
To understand the amount and types of plastic collected for recycling, data is required from the collection system or from the MRFs for all collection streams. The NRRP Taskforce estimated the annual tonnage of recycled plastic in Aoteaora New Zealand to be 45,000 tonnes, of which 90% was exported.
Household kerbside
Details on the amount of plastic collected at kerbside for recovery may be found in the waste assessment published by each council, though not all councils report this data. Variations in what is reported reflect the different arrangements councils have with contracted recycling processors and variability in resourcing across councils.
When councils include data on recovered plastics in their waste assessment, most report the total tonnage, and the percentage of plastic that makes up the total kerbside collection. Some councils report the type of plastics recovered grouped as PET (#1), HDPE (#2) and mixed plastics. Fewer councils report material type by colour (read the case study ‘Palmerston North City Council recycling’). Overall, few councils disclose the amount of plastic collected at kerbside for recycling.
The National Resource Recovery Project Situational Analysis estimated the annual tonnage of plastic collected for recycling from household sources to be 25,000 tonnes (roughly 55% of the total recovered plastic – the rest being from commercial and other sources, as discussed below)66F The analysis reported the typical composition of plastic waste within total kerbside recycling collection as 2% PET (#1), 2% HDPE (#2) and 4% mixed plastics, excluding contamination, but noted that there is significant variation in the materials accepted to make up these grades. For example, while all councils accept PET (#1) in kerbside recycling, only 71% accept PS (#6).
Available data for each council can be found in their respective waste assessments. For example, in 2016 the plastic component of Auckland’s kerbside recycling was reported to be 7,172 tonnes, representing 5% of total quantity of recyclables collected. Plastics are separated into three categories in Auckland: 1,039 tonnes HDPE (#2), 2056 tonnes PET (#1) and 4,077 tonnes mixed plastic in 2016.[11]
Annually, 25,000 tonnes of recycled plastic are collected from households, which is the equivalent of the weight of plastic beverage containers consumed in Aotearoa New Zealand.
Public place collection
Data on rates of recycling have been published in the Public Place Recycling voluntary product stewardship scheme 2016 annual report. In the four years included in the report, a total of 462 tonnes of plastic rubbish had been collected for recycling via public place collection systems.
Annual tonnes of plastic recycled through the public place collection scheme
| Commercial (tonnes) | Councils (tonnes) | |
|---|---|---|
| 2012 | 87 | 52 |
| 2013 | 99 | 17 |
| 2014 | 102 | 18 |
| 2015 | 73 | 14 |
Between 2012 and 2015, around 460 tonnes of plastic was recycled through the public place collection scheme in Aotearoa New Zealand
Soft plastic recycling scheme
Most local council recycling schemes do not collect soft plastic, but the industry-led Soft Plastic Recycling Scheme collected 365 tonnes (approximately 91 million bags) in 2017, roughly 50 tonnes per month. The nationwide Soft Plastics Recycling Scheme was put on hold in December 2018 after recyclers in Australia stopped accepting the material, but as of October 2019 has resumed in Auckland, Hamilton and Wellington at approximately 50 locations, with onshore processors using the plastic for products such as fence posts and ducting.
In 2017, 365 tonnes of soft plastics were recycled – but a lack of recycling market for these plastics meant that in the following year, plastic was stockpiled whilst new onshore markets were developed and a percentage of non-conforming plastic was landfilled
Commercial recycling collections
Unlike household waste, commercial plastic waste tends to be clean and homogeneous, and as a result has been less impacted by restrictions imposed by China relating to importing contaminated waste plastic. The National Resource Recovery Taskforce did not report the proportion of recycling waste that is from commercial sources, but given that 55% is reportedly from household waste, we can assume that commercial sources contribute less than 45% of recycled plastic in Aotearoa New Zealand (20,000 tonnes or less).

Plastic sent overseas for recycling
Traditionally, our country has sent a significant proportion of our plastic waste (~90%) overseas. The amount of exported plastic waste is captured within the ‘Plastics and articles thereof’ trade commodity.[12] In 2017, China instituted a new policy that significantly reduced their intake of low-value waste. Between 2016 and 2018, the tonnage of plastic waste exported from Aotearoa New Zealand has decreased overall (see figure below). The most significant changes have been a decrease in waste exported to China and Hong Kong, as a result of policy changes, and a subsequent increase in export to Indonesia and Malaysia. China’s National Sword policy, recent policy changes by South East Asian Nations, and ammendments to the Basel Convention have changed the environment in which MRFs can export plastic waste. These changes highlight the need for onshore processing capabilities for recycling plastic in Aotearoa New Zealand and incentives to reduce the use of non-recyclable plastics so that recyclable plastic is not landfilled here.
Plastic waste export data suggests that around 15,000 tonnes of plastic waste that was previously sent offshore is either being recycled, stockpiled or landfilled in Aotearoa New Zealand each year

Tonnes of plastic waste exported from Aotearoa New Zealand.
Plastic recycled onshore
A proportion of the plastic material collected for recycling in Aotearoa New Zealand is recycled onshore. This has increased in recent years in response to China’s National Sword policy, with the opening of new recycling facilities such as Flight Plastics. Based on the amount of plastic collected for recycling and exported, around 10,000 tonnes of plastic is recycled onshore. That is likely to be an overestimate as a proportion of plastic collected for recycling will be contaminated and unable to be recycled.
Plastic sent to landfill
In Aotearoa New Zealand, plastic that is not recycled goes to landfill. Landfills are classified into 5 classes as municipal (class 1) and non-municipal (classes 2-5). Each accepts different types of waste, described in detail by WasteMINZ.[13]
Waste levy
Under the WMA, a disposal levy of $10/tonne was introduced for class 1 landfills. Class 1 landfills accept all waste, but represent only 11% of consented waste disposal facilities. Class 2-5 landfills are not levied under the Act. This means that industrial, commercial, household and municipal solid waste types are always levied, but other waste types are only levied if they are landfilled in a class 1 landfill. Disposal sites can be ‘consented’ or ‘permitted’. A permitted activity site does not require resource consent or monitoring and as such the ability to collect data for these sites is limited.
The 11% of landfills that are currently levied are required to submit monthly information on the net amount of waste disposed of at their facilities (gross tonnage minus diverted tonnage) in order to pay the levy, so there is good quality data available on the quantity of material that is going to levied disposal sites. Data is managed through the Ministry for the Environment’s online waste levy system (OWLS). Expansion of OWLS to include other landfills and to collect further information could be a potential way to improve data on tonnes of waste sent to and diverted from landfill.
In August 2018, the Ministry for the Environment announced that part of their waste work programme would include looking at options to expand the waste dispoal levy to apply to currently non-levied landfills.
Expansion of OWLS to include other landfills and to collect further information could be a potential way to improve data on tonnes of waste sent to and diverted from landfill
Tonnes of waste to landfill
A study reviewing potential impacts of adjustments to the waste levy estimated the total waste generation for Aotearoa New Zealand in 2015 to be 15,311,725 tonnes, of which 9,660,315 tonnes were landfilled and roughly a third of that into class 1 (municipal) landfill (see table below).
Tonnages and proportion of plastic waste to landfill and recovery in Aotearoa New Zealand in 2015
| Waste destination | Tonnes | Data source for tonnage |
|---|---|---|
| Class 1 Landfill | 3 220 888 | 2015 data from Ministry for the Environment (2016) Monthly Levy Graph (background data) |
| Class 2 Landfill | 2 575 771 | Estimated from 2013 data with waste growth equivalent to change in real GDP applied from Ministry for the Environment (2014) New Zealand Non-Municipal Landfill Database, October 2014 |
| Class 3 Landfill | 64 394 | |
| Class 4 Landfill | 3 799 262 | |
| Farm dumps | 1 362 666 | |
| Recovery | 4 288 743 | |
| Total waste generated | 15 311 725 | Estimate based on data from various sources (details provided in report) |
Though technically all types of landfill accept plastic waste, the proportion of plastic waste going to each class of landfill differs. Studies of landfill composition suggest that plastic makes up a significant proportion of waste in municipal landfill, but a very small (or nil) proportion of non-municipal landfill (see Appendix 12 for more information). Therefore, to estimate the total volume of plastic waste going to landfill, we focus here on municipal landfill.
Municipal landfill
Data on tonnages of waste to sent to municipal landfill (class 1) in Aotearoa New Zealand have been aggregated by the Ministry for the Environment (or contractors) in order to review the effectiveness of the waste disposal levy.The most recent publically available estimates on the tonnages of waste were published in 2017. For the period July 2013 to June 2016, levied waste disposal facilities received a total of 10,681,295 tonnes of gross tonnage of waste. From this, 1,207,786 tonnes of material were diverted, leaving total net waste tonnage of 9,473,509 tonnes. Using this data, the OECD reported Aotearoa New Zealand’s total and per capita waste (see figure below). Except for 2012, net waste to levied landfills has increased every year since the levy was introduced. Note that plastics is not the only type of waste reported in these figures and that this is the same data from which the estimate in the table below is drawn.
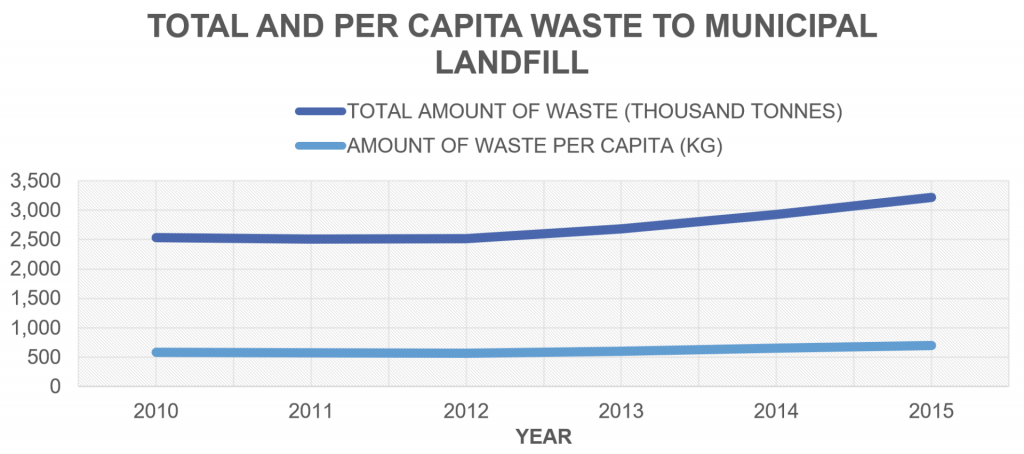
Total and per capita waste to municipal landfill in Aotearoa New Zealand.
In 2015, over 3 million tonnes of waste, including plastic, went to municipal landfill in Aotearoa New Zealand
The waste levy was implemented in 2009, therefore we would ideally compare tonnages of municipal waste to landfill before and after this time to determine the effectiveness of the waste levy. However, we cannot compare these due to changes in data collection methods. It is also important to consider that the global financial crisis of 2008 led to decreases in consumption and waste and changes around that time may not be solely attributable to the levy.
Proportion of landfilled waste that is plastic
To understand the amount of plastic waste we are landfilling, we need to know the proportion of the waste going in to landfill that is plastic. The Ministry for the Environment website states that, “at present we don’t have data on the composition of what’s going into landfills or the amount of resources that are being diverted from landfill”. Where the Ministry for the Environment has sampled waste composition at landfill, they have followed the Solid Waste Analysis Protocol (SWAP). Waste is surveyed at domestic source or disposal facilities, using a specific sampling regime and classification system, to estimate proportions.
Through SWAP analysis at a sample of municipal waste disposal facilities between 2004 and 2012, it was shown that the proportion of plastic decreased between 2004 and 2008, but increased between 2008 and 2012 (see figure below). In 2012, plastic made up a large proportion of waste, second only to food and garden waste. Together, plastic and food and garden waste made up nearly 40% of municipal waste. Also notable is the increase in textile waste, a proportion of which will be synthetic materials of plastic fibre. These surveys have not been conducted by the Ministry for the Environment since 2012.

Estimated proportion for common waste streams at municipal waste disposal facilities from 2004 to 2012. Source: Ministry for the Environment.
More recently, Perrot et al. estimated landfill waste composition based off publically available regional council data between 2011 and 2017.[14] Their estimates put plastics at 12.1% of municipal landfill waste (see figure below). This aligns with Auckland Council’s estimates of the proportion of waste to landfill that is plastic. Redvale Landfill and Energy Park estimated that plastics were around 14% of the waste stream (read the case study ‘Modern landfill – a waste-to-energy innovation’).
Private contractors often assess waste composition to landfill for clients, including councils. Therefore additional and more recent data do exist, but it is not aggregated, easily accessible or in the public domain. The main reason for the lack of aggregated, accessible data is that there is no requirement for commercial contractors to provide data to local or central government under current law. Some councils are introducing bylaws to require waste operators to be licensed and ensure these licensed waste operators report waste data.

Waste composition according to regional council data from Perrot et al.
The main reason for the lack of aggregated, accessible data is that there is no requirement for commercial contractors to provide data to local or central government under current law.
Based on available data, we can make a conservative estimate of the proportion of plastic waste to landfill by multiplying the total waste to class 1 landfills (approximately 3.2 million tonnes) by the estimated proportion of waste that is plastic (12%), giving a total of 384,000 tonnes.
If 12% of waste is plastic in Class 1 landfill, around 380,000 tonnes of plastic would have been landfilled in 2015
Diversion potential of plastics to landfill
During a SWAP analysis, the proportion of plastic waste sent to landfill that was recyclable may be recorded. Some councils have published this information within their waste assessments. For example, Auckland Council reported that 0.5% of the total proportion of plastic waste (excluding kerbside waste) sent to the Auckland Council owned Waitakere transfer station in 2016 was recyclable – which equates to 6 tonnes per week. For kerbside refuse, the diversion potential was reported at 0.5% of total waste for PET (#1) and HDPE (#2) containers (0.05 kg per bin) and 1.2% of total waste for plastics #3-7 containers (0.12 kg per bin).
Waste from manufacturing process
A proportion of plastic that goes into the manufacturing process is lost as scrap material or rejected products due to design issues or defects. The most recent published data on the amount of pre-consumer industrial waste in Aotearoa New Zealand comes from a 2005 report by Plastics NZ. The report identified 4,487 tonnes of waste from this source for recycling in New Zealand. The report figure excludes plastic waste that was recycled in-house through feedstock recycling. Recyclability is not an issue for this plastic as it has generally come from a clean manufacturing stream, as long as the plastic type is recyclable. Plastics NZ have set up a database to allow manufacturers to exchange manufacturing waste to improve its utilisation.
Knowledge gaps
While there are several studies reporting varying levels of data for landfilled or recovered waste, comprehensive data is not available or consistent in order to aggregate a national data set for plastic waste that captures weight by material type.
Opportunities for capturing waste data
National Waste Data Framework
In response to the lack of standardisation in waste data collection in Aotearoa New Zealand, WasteMINZ developed a National Waste Data Framework (NWDF) that could be implemented by both local government and the waste industry across the country. This was articulated by the National Waste Data Framework Project:
Lack of standardisation has meant it is, at the least, time-consuming and difficult to meaningfully collate and share data, at any level, or to accurately monitor the impacts of interventions on waste flows. This has long been recognised as preventing both the public and private sectors from effectively planning, monitoring, and reporting on waste issues and developing and prioritising solutions.”
Stage 1 of the project was completed in 2015 and was supported by a grant from the Waste Minimisation Fund and contributions from local government partners.
The framework:
- Establishes a set of definitions to act as a common language for collecting and reporting waste data
- Determines what data are gathered
- Determines who gathers these data
- Specifies how the target data are gathered
- Directs who data are reported to
- Sets out how the data that are collected are collated and presented.
The framework sets out protocols for gathering and reporting data on solid waste that is disposed of at disposal facilities (as defined by the WMA 2008), and also for presenting information about waste and diverted material services and facilities. The seven reporting indicators established by the NWDF collect data required for the WMMP assessment which each council has to perform.
The framework is designed with councils at the centre of data collection. Within the NWDF documentation, this is cited to be a result of the Ministry for the Environment under the previous government stating a clear preference for voluntary methods, in the first instance. In the four years since completion, efforts to align data collection with the NWDF have been varied due to the voluntary nature of the framework.
- Currently implementing the framework: Two regional groups of councils are currently working to implement the framework. Wellington councils (8 councils in total), and the Bay of Plenty and Waikato Councils (16 councils in total), as well as Auckland Council.
- Active efforts to implement: Several councils have made active efforts to implement the framework at some level, such as aligning weighbridge codes, using the NWDF data in their Waste Assessments, or initiating licensing of waste operators/adopting new bylaws. This includes Central Hawkes Bay, Dunedin, Hamilton, Hutt City, Mackenzie District, Matamata-Piako, Opotiki, Palmerston North, Ruapehu, South Waikato, Tauranga, Timaru, Waipa, Whakatane, Wellington and Western Bay.
- Some alignment: around 40 councils have made some level of alignment of their data collection with the NWDF. This is mainly through SWAP audit methodology aligning the ‘activity source data’ with the NWDF.
- No alignment: the remaining councils may have made no steps to begin aligning their data collection with the NWDF.
The Ministry for the Environment highlights the NWDF as a resource for councils to refer to but does not mandate use, though this is possible via the WMA. Given that the NWDF is ready to go and could be implemented by all councils due to not being overly prescriptive or rigid, mandating use would advance waste data quality in Aotearoa New Zealand. The limitations of the framework, such as the lack of centralised data collection/maintenance and the fact it doesn’t address diverted materials or non-levied landfill sites could be addressed over time through a clear and structured plan.
In the 4 years of voluntary implementation of the National Waste Data Framework, only around one third of local councils are currently working to fully implement the framework
How much plastic is leaking into the environment in Aotearoa New Zealand?
A recent study that quantified the global environmental losses of plastics across the entire plastic value chain found that approximately 6.2 million tonnes of macroplastics and 3 million tonnes of microplastics were lost into the environment in 2015. Mismanaged municipal solid waste in lower income countries was identified as the major source of larger plastic, while abrasion of tyres and road markings were the major sources of microplastics.[15]
In the context of Aotearoa New Zealand, there are relatively recent approaches to measuring litter in certain parts of the environment. These studies can help us begin to understand the scale of the plastic pollution problem locally, identify the most problematic plastic products, and provide a baseline to track improvements based on behaviour or policy changes. It is important that ongoing efforts among researchers and citizen scientists to measure the scale and impact of plastic pollution do not occur in silos, rather that frameworks for collection are consistent and learnings are shared between groups.
Māori use both quantitative and qualitative approaches to assess and monitor the environment and ecosystems (e.g. waterways and taonga species). This has led to ways of knowing how to read critical shifts in the environment that can tell us when to restrict use of resources or change practices that are damaging. Ongoing observations of the natural environment are often actively led by local iwi/hapū.
Land-based plastic pollution
Most plastic that ends up in the marine environment comes from land. This occurs through littering behaviour, mismanaged collected plastic waste, and also the loss of plastic that was intentionally placed in the environment – for example, through landfill disasters (read the case study ‘Compromised landfills at risk during extreme weather’).
National Litter Survey
On behalf of the Public Place Recycling Product Stewardship Scheme, which aims to increase recycling and abate loose litter, Waste Not Consulting conducted two National Litter Surveys in Aotearoa New Zealand. The first, published in 2015, provided baseline data prior to the initiation of the recycling scheme. The purpose of the second report, published in 2018, was to monitor outcomes of the scheme.
Between 2015 and 2018, there was a 5% reduction in the number of litter items counted. However, there was a 22% decrease in the number of transects that had no or low amounts of litter.
National Litter Survey: baseline and outcome monitoring for the Public Place Recycling Product Stewardship Scheme
| 2014/15 | 2017/18 | |
|---|---|---|
| Visible and bulky litter | 18,620 items/581,764m² of public space 32 items/1,000m² surveyed | 17,735/581,764m² of public space 30.5 items/1,000m² surveyed |
| Transects graded as having virtually no visible litter or mostly free of visible litter | 87% | 65% |
For plastic litter specifically, items were classified by type of plastic for drink packaging (e.g. PET (#1) drink containers and HDPE (#2) drink containers) but for food packaging plastics were grouped with multi-material items.
The 2017/18 litter survey results identified a significant proportion of litter was plastic packaging. Food packaging of plastic or mixed materials made up 13.3% of the litter count, and plastics drinks packaging made up 5.8% (excluding ‘other drink packaging’, which may contain some plastic items such as bottle tops). Of the plastic drinks, nearly half (2.3%) were PET (#1) bottles, which are recyclable. Soft plastic packaging contributed 9.1% of litter, but was not specifically measured in the baseline data.
These findings illustrate that people mismanaging single-use plastic packaging is a key contributor to plastic in the environment in Aotearoa New Zealand.
Keep New Zealand Beautiful Litter Audit
In 2019, Keep New Zealand Beautiful (KNZB) carried out a comprehensive National Litter Audit, which compiled data through the physical inspection and visual counting of litter in a number of specific, fixed sites. The methodology was based on international best practice and developed in consultation with Statistics NZ, the Ministry for the Environment and the Department of Conservation. The information collected provides empirical data on regions, the quantities, types, locations, and brands of litter deposited across the country.
Key findings of the litter audit include:
- The overall average number of items was 118/1,000 m² across the 413 sites surveyed
- The overall average litter weight was 0.62 kg/1,000 m², and the overall average estimated volume was 7.35 L/ 1,000 m2
- Plastic items contributed both the second largest litter weights and numbers of litter items to the overall national litter stream
- Cigarette Butts and vaping cartridges – which are both plastic – were the most frequently identified items per 1,000 m² nationally, however they contributed the smallest weights and volumes to the litter stream.
Plastic pollution in waterways
Land-based plastic pollution finds its way into the ocean through waterways. Understanding the pattern and extent of plastic travelling through waterways is crucial to inform efforts to capture leaked plastic and prevent it entering the marine environment.
Palmy Plastic Pollution Challenge
A citizen science programme in Palmerston North reported preliminary findings from a litter audit to benchmark all forms of plastic pollution in the city that took place in April 2019. Plastic litter was measured across 41 sample sites from the city streams then analysed by volunteers though a process of sorting, counting and weighing items of stream litter/waste.
In total over 11,000 litter items were collected from the sample sites, representing approximately 3% of the total length of the main city streams. This finding equates to approximately 2,680 items of litter / plastic per site (1,000 m²). Food wrappers made up almost 25% of all items collected. The initial estimate is that this equates to over 360,000 items of mostly plastic litter currently in the process of being mobilised from the streams into the Manawatu River.
The significant difference in reported litter rates between the land-based survey (30.5 items/1,000 m²) and surveyed waterways (2,680 items/1,000 m²) may be attributable to waterways being the funnel for litter to the ocean, different methods, and different regions surveyed. Further research to measure and understand plastic pollution processes in Aotearoa New Zealand is necessary.
Further research to measure and understand plastic pollution processes in Aotearoa New Zealand is necessary
Marine-based plastic pollution
The marine environment is the ultimate repository for plastic waste – quantifying the amount of marine plastic pollution and identifying sources and routes of plastic debris to the ocean is critical. Modelling of how marine pollution travels from its point of origin and moves for up to a decade is illustrated in the Plastic Adrift resource. However, it is difficult to understand the scale of plastic litter that comes from mismanaged waste in Aotearoa New Zealand as opposed to that which reaches our shores from plastic leaked into the environment overseas because marine plastic debris shifts with wind and ocean currents. A tool to model ocean currents being developed by researchers at the Cawthron Institute as part of the Sustainable Seas National Science Challenge will help address these issues.
Plastic pollution from marine-based industry
The UNEP estimates at least 640,000 tonnes of fishing gear are lost every year. While there are no data quantifying the amount of ocean plastics attributed to mismanagement of waste from Aotearoa New Zealand, there is evidence that suggests that some of the waste comes from our shores or offshore activities.
US mariner, Captain Charles Moore, first described the phenomenon of the oceanic gyres accumulating plastic in 1997. Ocean gyres are slowly churning eddies of plastic ‘smog’ covering areas bigger than many countries. Two of the five gyres are in the Pacific Ocean – one off the coast of California and the other west of Chile. While it may seem these are far enough from Aotearoa New Zealand’s shores to be ‘not our problem’, the findings of a 2016/2017 expedition by Algalita Marine Research and Education to the South Pacific Sub-Tropical Gyre to the southern Pacific gyre reminds us otherwise.
In their studies of plastic in ocean gyres, Algalita Marine Research and Education South Pacific identified fish bins belonging to New Zealand seafood companies (see figure below). At sea, the researchers collected 1 bin from Talleys Group Limited and 1 bin of unknown brand, but identified as being manufactured in New Zealand. The researchers were shown 24 bins by two people that had washed ashore on Rapa Nui. Of the bins found, 18 were from identifiable New Zealand and Australian companies.

Example of plastic waste from a New Zealand fisheries company found in the ocean. Source: Algalita Marine Research and Education South Pacific.
Australian and New Zealand fisheries companies with bins found by Algalita Marine Research and Education South Pacific
| Company | Number of bins |
|---|---|
| Unidentifiable | 6 |
| Talley’s | 4 |
| Deep Cove Fisheries | 4 |
| Sanford | 3 |
| United Fisheries | 2 |
| Bluewater Products Dunedin | 1 |
| Dallington Fish Supply Christchurch | 1 |
| Whitecloud Seafoods Christchurch | 1 |
| Skeggs Foods Nelson | 1 |
| RF McLaughlin and Consolidated Fishermen Australia | 1 |
This study does not identify the proportion of ocean waste that comes from our shores, but indicates that emphasis must be placed on quantifying the scale of marine plastic pollution from offshore activities, and identifying the key sources or activities (e.g. lost gear), in order to support activities to reduce plastic mismanagement during offshore activities. It highlights the need to consider the fisheries industry when rethinking plastics in Aotearoa New Zealand.
Plastic ocean debris
Several studies have identified plastic pollution in the marine environment around Aotearoa New Zealand. Floating consumer and industrial plastics were identified in the Hauraki Golf during trawls undertaken between July to September 2008 and consisted of colours and lengths likely to be mistaken as food items for small to medium seabirds.[16] Sea Cleaners, who have been operating and collecting data on volumes of waste in Aotearoa New Zealand’s waters, have removed over 8.8 million litres of rubbish from the water, including plastics. The organisation currently removes approximately 160,000 litres per month.
Marine microplastics
Globally, it is estimated that as many as 51 trillion microplastic particles — 500 times more than the stars in our galaxy — litter our oceans and seas. The remoteness and relatively low population density of Aotearoa New Zealand may be thought to result in low levels of marine microplastic pollution. However, levels have been shown to be independent of population density in other areas.[17]
Eriksen et al. modelled levels of plastic, including microplastic, in surface waters around the globe, estimating a minimum of 5 trillion particles weighing over 250,000 tonnes, of which 35,500 tonnes were microplastic.[18] The level of microplastic pollution in the marine environment around Aotearoa New Zealand is currently poorly understood and levels within surface waters have not been examined.
In 1977 and 1978, Gregory identified the wide distribution of preproduction plastic pellets (nurdles) around Aotearoa New Zealand.[19] These pellets were found in highest densities around main population centres (Auckland, Wellington and Christchurch), but were also found in remote areas. More recently, work as been carried out looking at the density of nurdle pellets in Wellington Harbour by Algalita Marine Research and Education South Pacific, but the findings have not yet been published.
Assessment of coastal sediment microplastics was carried out for beaches around Christchurch. A range of different morphologies and polymer types were identified.[20] Pellets and fragments were identified, and fibres were disregarded in this study. The predominant polymer types were PS (#6) (55%), PE (polyethylene) (21%) and PP (#5) (11%).
An assessment of 29 Auckland beaches and waterways identified microplastic particles in most samples, with 90% of microplastics being fibres. Of these, about 1/3 were plant-based, such as cellulose or regenerated cellulose like rayon. The other main sources of fibres were PE (polyethylene), PET (#1) and PP (#5).[21]
There is even less known about the levels of microplastics within biota (the impacts of microplastic pollution on biota are discussed here). As mentioned earlier, a recent local study identified zero to 1.5 microplastic particles per green-lipped mussel.[22] Another recent study looked at plastics within the guts of food species finfish from the South Pacific region, including some samples from Aotearoa New Zealand water.[23] Plastic ingestion rates were found to be comparative with global ingestion rates. Microplastic characteristics included fibres, film and fragments, and represented a range of polymer types, including PVC (#3), PP (#5), Rayon, PE and PES (polyethersulfone). The majority of polyester and rayon microplastics were fibres, consistent with the high level of both these in clothing and resulting wastewater discharged to the marine environment. Vertical habitat differences (pelagic vs benthopelagic) were found to correlate with the levels of microplastics within the stomachs of the fish.
Even less is known about the levels of microplastics in Aotearoa New Zealand’s freshwater systems. A 2019 study examined the levels and types of microplastics streams in Auckland, across a gradient of urbanisation.[24] All streams were found to contain microplastics similar to levels found in large systems. Levels weren’t related to population density, and local-scale factors are thought to have a greater influence on microplastic abundance than catchment-scale factors.
Airborne plastic pollution
These has been less investigation into the presence of microplastics in the air and how far it can travel in the atmosphere. A growing body of evidence shows that microplastics are present in the air, in both densely populated city and remote mountain environments, and can travel a distance up to 95 km.[25]
Knowledge Gaps
There are significant gaps in our understanding of the scale of plastic leakage into our land and marine environments, for both micro- and macroplastics, as well as the impacts of these.
Several Aotearoa New Zealand-specific studies are underway to expand our understanding of plastics in the environment, but data is not yet available. These include:
- Analysing plastic pollution at a river in Wellington
- Fisheries New Zealand study underway to quantify plastic particles in plankton sample
- Student project investigating microplastics in freshwater sediments and road dust[26]
- Research on how local waste management practices influence plastics found on beaches as part of a national study of 41 east coast beaches.
Recommendations
There is a need for a national coordinated approach to data collection on plastics, building on previous calls for this from by SBN, WasteMINZ and Greenpeace.[27] This is addressed by the suite of recommendations within recommendations 2 and 6.Key considerations for implementing these recommendations:
- Alignment to and connectivity with international data collection frameworks could guide data collection efforts (note: Sustainable Coastlines’ methodology aligns UNEP/IOC guidelines on surveying and monitoring of marine litter; Keep New Zealand Beautiful’s methodology is based on global methods, including UNEP guidelines).
- Data collection can be developed to meet the needs of pacts and pledges, including the NZ Plastic Packaging Declaration, New Plastics Economy Global Commitment, UNSDGs and the Basel Convention
- Ongoing local efforts could be drawn on and built on, including:
- National Waste Data Framework
- GS1 supply chain database
- Rural waste surveys by GHD (see here and here)
- Agrecovery and Plasback schemes
- Unitec study to quantify plastics in construction
- Local council waste assessments
- Litter Intelligence (Sustainable Coastlines)
- Keep New Zealand Beautiful litter audits
- Sea Cleaners data collection
- NIWA study analysing pollution processes in rivers
- Marine microplastic research
- GESAMP ocean plastic monitoring guidelines
- Operation Clean Sweep®
- Algorithms and data created by Crunch & Flourish
- Some councils (e.g. Northland Regional Council) are using the Sustainable Coastlines’ Litter Intelligence framework as part of their environmental monitoring and other councils could follow suit and other groups (Raglan Citizen Scientist Beach Project) are building on this to also measure microplastics.
References
[1] Harmonised trade data from Statistics NZ Infoshare
[2] Estimates based on export waste and population/GDP data, not accounting for imported finished products, packaged goods, secondary and tertiary packaging
[3] National Resource Recovery Taskforce estimates based on voluntary reporting
[4] Conservative estimate for landfills based on data for class 1 landfills: 12% (Perrot et al. 2018) by tonnes (Eunomia Consulting)
[5] Based on voluntary manufacturer surveys from 2005
[6] Taken from litterintelligence.org as of 11 November 2019
[7] Keep New Zealand Beautiful, “National Litter Audit”, 2019
[8] Geyer et al., “Production, Use, and Fate of All Plastics Ever Made,”
[9] Geyer et al., “Production, Use, and Fate of All Plastics Ever Made,”
[10] Packaging Council of New Zealand/Accord Secretariat, “New Zealand Packaging Accord 2004 Year Five Progress Report”, 2009
[11]Adapted from data in Auckland Council, “Auckland’s Waste Assessment 2017”, 2017
[12] Codes: 3915100000; 3915200000; 3915300000; 3915900000.
[13] WasteMINZ, “Technical Guidelines for Disposal to Land”, 2018
[14] Perrot, J.-F. Municipal Waste Management Strategy Review and Waste-to-Energy Generation Potential in New Zealand. Master’s Thesis, The University of Auckland, Auckland, New Zealand, 2018
[15] Ryberg et al., “Global Environmental Losses of Plastics across Their Value Chains,”
[16] Young et al., “Plastic Debris and Seabird Presence in the Hauraki Gulf, New Zealand,” New Zealand Journal of Marine and Freshwater Research 44, no. 3 (2010)
[17] Hirai et al., “Organic Micropollutants in Marine Plastics Debris from the Open Ocean and Remote and Urban Beaches,” Marine Pollution Bulletin 62, no. 8 (2011)
[18] Eriksen et al., “Plastic Pollution in the World’s Oceans: More Than 5 Trillion Plastic Pieces Weighing over 250,000 Tons Afloat at Sea,” PLOS ONE 9, no. 12 (2014)
[19] Gregory, “Plastic Pellets on New Zealand Beaches,” Marine Pollution Bulletin 8, no. 4 (1977);Gregory, “Accumulation and Distribution of Virgin Plastic Granules on New-Zealand Beaches,” New Zealand Journal of Marine and Freshwater Research 12, no. 4 (1978)
[20] Clunies-Ross et al., “Synthetic Shorelines in New Zealand? Quantification and Characterisation of Microplastic Pollution on Canterbury’s Coastlines,” New Zealand Journal of Marine and Freshwater Research 50, no. 2 (2016)
[21] Kate Parker, “Turning the Tide on Plastic Microparticles”, 2019
[22] Webb et al., “Microplastics in the New Zealand Green Lipped Mussel Perna Canaliculus,”
[23] Markic et al., “Double Trouble in the South Pacific Subtropical Gyre: Increased Plastic Ingestion by Fish in the Oceanic Accumulation Zone,”
[24] Dikareva et al., “Microplastic Pollution in Streams Spanning an Urbanisation Gradient,” Environmental Pollution 250 (2019)
[25] Dris et al., “Synthetic Fibers in Atmospheric Fallout: A Source of Microplastics in the Environment?,” Marine Pollution Bulletin 104, no. 1-2 (2016); Cai et al., “Characteristic of Microplastics in the Atmospheric Fallout from Dongguan City, China: Preliminary Research and First Evidence,” Environmental Science and Pollution Research 24, no. 32 (2017); Allen et al., “Atmospheric Transport and Deposition of Microplastics in a Remote Mountain Catchment,” Nature Geoscience 12, no. 5 (2019)
[26] Supervised by Sally Gaw at the University of Canterbury
[27] Blumhardt, “Implementing the Plastic-Free New Zealand Action Plan”, 2019